Automated prostate multi-regional segmentation in magnetic resonance using fully convolutional neural networks
Summary
Objective Automatic MR imaging segmentation of the prostate provides relevant clinical benefits for prostate cancer evaluation such as calculation of automated PSA density and other critical imaging biomarkers. Further, automated T2-weighted image segmentation of central-transition zone (CZ-TZ), peripheral zone (PZ), and seminal vesicle (SV) can help to evaluate clinically significant cancer following the PI-RADS v2.1 guidelines. Therefore, the main objective of this work was to develop a robust and reproducible CNN-based automatic prostate multi-regional segmentation model using an intercontinental cohort of prostate MRI. Methods A heterogeneous database of 243 T2-weighted prostate studies from 7 countries and 10 machines of 3 different vendors, with the CZ-TZ, PZ, and SV regions manually delineated by two experienced radiologists (ground truth), was used to train ( n = 123) and test ( n = 120) a U-Net-based model with deep supervision using a cyclical learning rate. The performance of the model was evaluated by means of dice similarity coefficient (DSC), among others. Segmentation results with a DSC above 0.7 were considered accurate. Results The proposed method obtained a DSC of 0.88 ± 0.01, 0.85 ± 0.02, 0.72 ± 0.02, and 0.72 ± 0.02 for the prostate gland, CZ-TZ, PZ, and SV respectively in the 120 studies of the test set when comparing the predicted segmentations with the ground truth. No statistically significant differences were found in the results obtained between manufacturers or continents. Conclusion Prostate multi-regional T2-weighted MR images automatic segmentation can be accurately achieved by U-Net like CNN, generalizable in a highly variable clinical environment with different equipment, acquisition configurations, and population. Key Points • Deep learning techniques allows the accurate segmentation of the prostate in three different regions on MR T2w images. • Multi-centric database proved the generalization of the CNN model on different institutions across different continents. • CNN models can be used to aid on the diagnosis and follow-up of patients with prostate cancer.
Key points
- Deep learning techniques allows the accurate segmentation of the prostate in three different regions on MR T2w images.
- Multi-centric database proved the generalization of the CNN model on different institutions across different continents.
- CNN models can be used to aid on the diagnosis and follow-up of patients with prostate cancer.
Introduction
Magnetic resonance imaging (MRI) is widely used for prostate cancer (PCa) detection, localization, and diagnosis [1], as digital rectal examination (DRE), prostate-specific antigen (PSA) testing, and blind biopsy have some limitations [2]. PSA protein is produced by both cancerous and noncancerous prostate tissue [3], being non-specific and usually not suitable for rendering a final diagnosis. Transrectal ultrasound (TRUS) blind biopsy might miss clinically significant tumors [4]. In recent years, MRI-guided and MRI/US-fusion-targeted biopsies have been developed, with a growing number of commercial devices allowing the multiparametric capability of MRI to target lesions for sampling. MRI/US fusion biopsies blend the advantages of real-time guidance by US with the benefits of specific targeting enabled by MRI [5].
MRI entails a significant diagnostic workload for radiologists. Prostate MRI reporting will benefit of the automated analysis of the gland to quantify volumes for indicators such as PSA density and tumor/prostate ratio with advanced computer-assisted detection (CADe) applications to help the radiologist in identification, location, and scoring of lesions. A robust and widely validated automated segmentation algorithm would provide efficiency in prostate and tumor volume calculations, streamlining of MRI/US fusion procedures and radiotherapy contours for dose painting [6, 7].
The differentiation between the central-transition zone (CZ-TZ), peripheral zone (PZ), and seminal vesicles (SVs) enables further development of clinical assessment tools following PI-RADS v2.1 [8], since PIRADS considers lesion location in scoring of suspected aggressive cancer. Additionally, prostate segmentation can be used for the automated extraction of imaging biomarkers such as apparent diffusion coefficient from diffusion-weighted imaging (DWI) and Ktrans from dynamic contrast-enhanced (DCE) sequences, used to evaluate potential tumoral regions [9, 10].
Automating the segmentation of the prostate presents a challenge due to the intra-patient, inter-patient, and inter-equipment variability present in MRI acquisitions. Recent developments in the field of deep learning (DL) can significantly improve the performance of automatic prostate segmentation using convolutional neural networks (CNN) [11], as well as in the differentiation of the CZ-TZ and PZ [12, 13]. To date, there has been no approach for validating CZ-TZ and PZ segmentation across multiple institutions, countries, and continents to support an accurate generalization. Furthermore, the inclusion of SV can help radiologists evaluate PCa invasiveness beyond the prostate gland. The validation of segmentation of CZ-TZ, PZ, and SV would add important insights into the use of CNN-based automated prostate segmentation for accelerating radiation therapy dose planning.
We propose a deeply supervised CNN-based automatic prostate multi-regional segmentation method to identify and differentiate CZ-TZ, PZ, and SV, validated across different institutions, countries, and continents.
Materials and methods
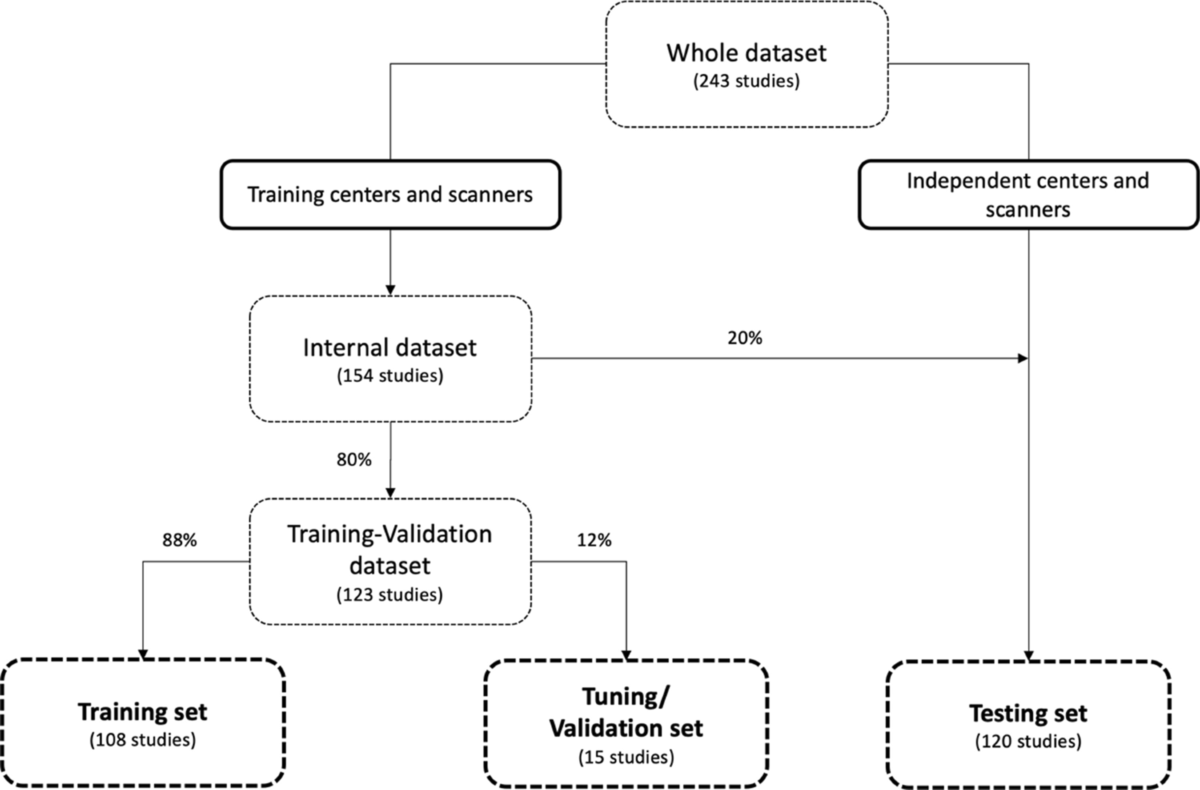
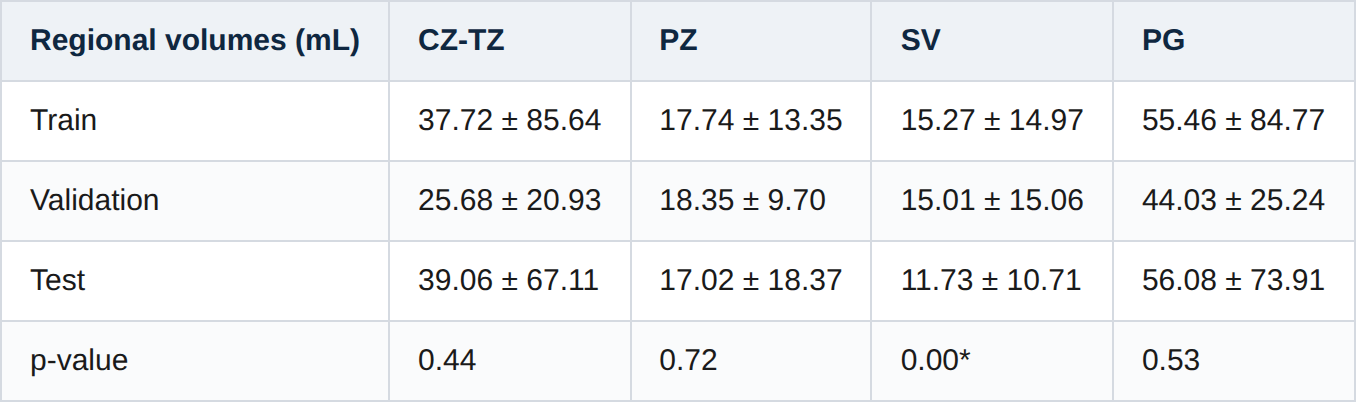
This highly heterogeneous datasets were standard-of-care prostate MRI examinations collected from 7 different countries across 3 different continents to address data variability (minimize overfitting) and external validation challenges. The total number of MRI studies gathered was 243. The dataset was collected retrospectively through an observational study approved by the Ethics Committee at every institution and waived from informed consent collection. The age of the subject cohort was within the range of 25 to 92 years old. A balance (50/50%) between non-clinically significant (PIRADS < 3) and clinically (PIRADS ≥ 3) significant prostate cancer patients was found in the dataset (121 non-clinically significant vs. 122 clinically significant, respectively). The latter was built by 18% PIRADS 3 (22 cases), 25% PIRADS 4 (30 cases), and 57% PIRADS 5 (70 cases). The studies were acquired from 10 different MRI scanner models from 3 vendors using a wide variety of acquisition parameters (Table 1). The cases were split into training set, validation set, and testing set (Fig. 1), and the volumes of the regions segmented for each dataset partition were measured (Table 2). An analysis of variance was conducted to check for differences across datasets. No statistically significant differences were found between the training, validation, and test datasets in terms of volume for both CZ-TZ and PZ and for the whole prostate gland (PG), which considers both CZ-TZ and PZ. However, statistically significant differences were found for the SV.
Table 1. Ranges of the technical parameters of the T2-weighted sequence included in the database
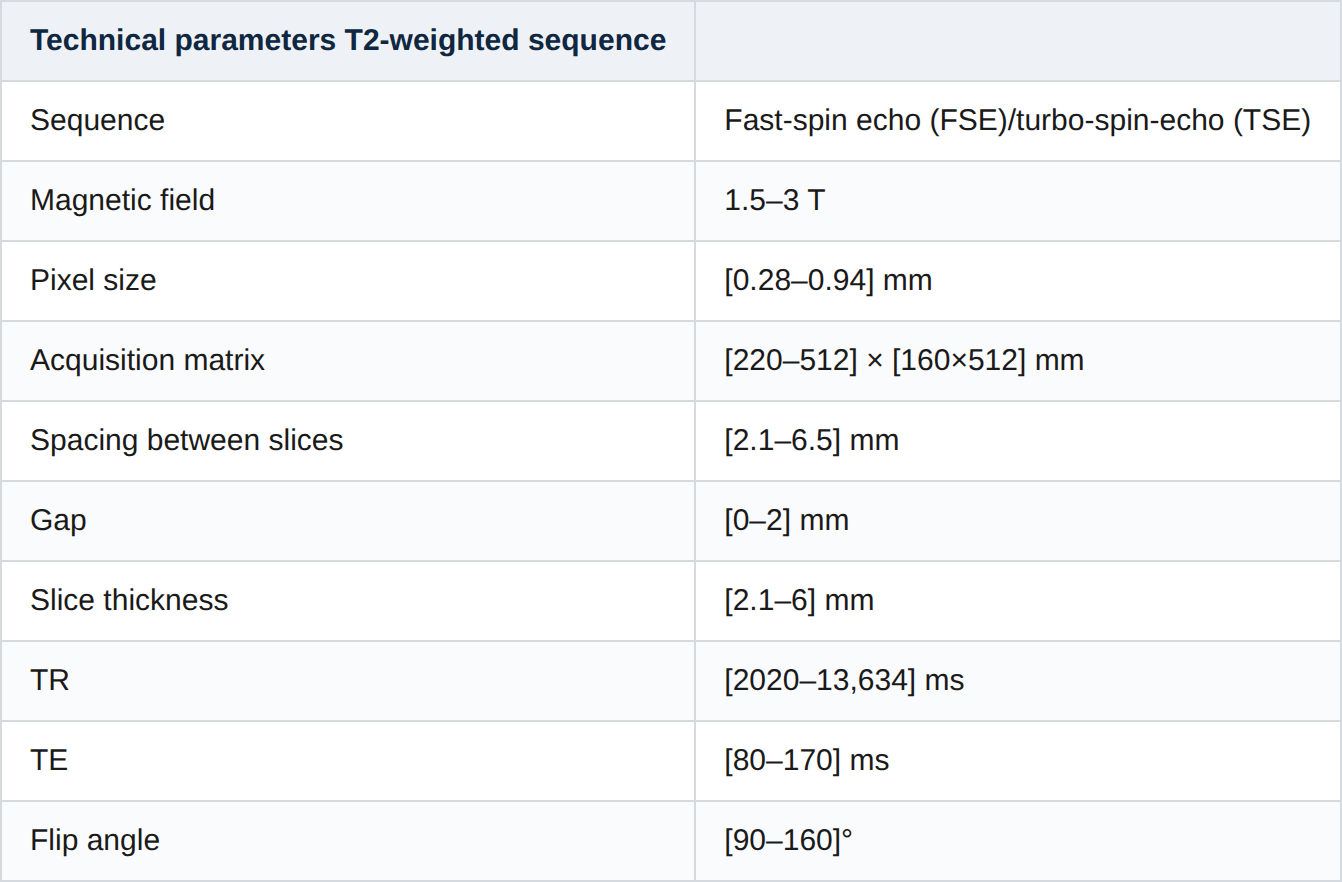

Fig. 1. Dataset for training, validation and testing of the proposed model.
Table 2. Volumes of the regions in each database partition. * statistical significant differences across datasets
Training and tuning datasets
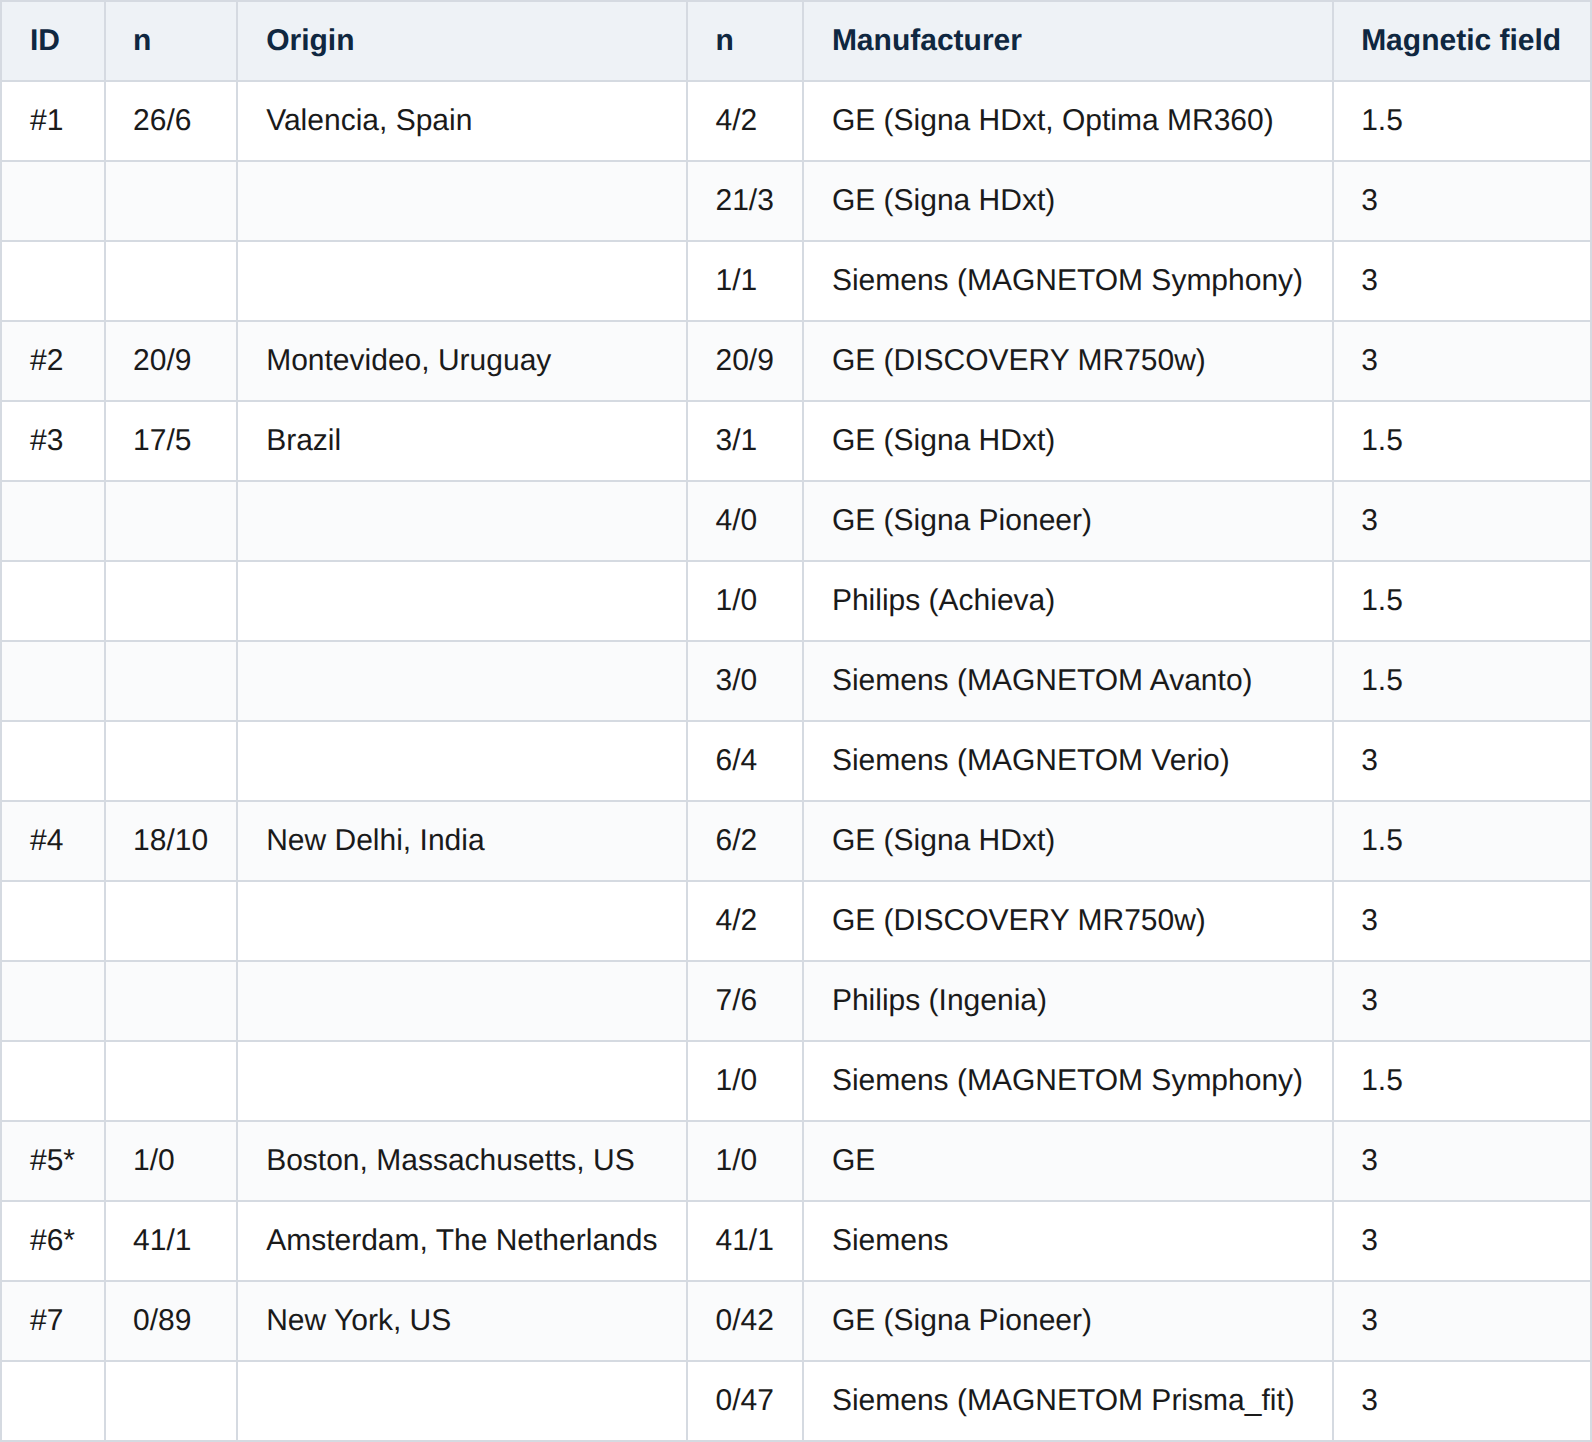
The training set included 123 transverse T2-weighted MR prostate examinations acquired from different MRI scanners with multiple acquisition protocols received and segmented between April 2017 and October 2019. The origin of the training database is described in Table 3. This dataset was split, leaving 88% (108 studies) for training purposes and the remaining (15 studies) for the tuning of the training hyperparameters. The proposed solution is based on 2D images; therefore, each single slice from each subset was used for training (2468 images) or tuning (363 images).
Table 3. Description of the sources used for the training-validation and test of the proposed model. For each source the manufacturer and magnetic fields are specified. Number of cases (n) refers to the number of cases in the training-validation/test datasets. *Promise12 public dataset [14]
Manual delineations of the CZ-TZ, PZ, and SV (Fig. 2) were performed by a team of two radiologists, each with at least 20 years' experience on pelvic MR, from the same center (University and Polytechnic Hospital La Fe in Valencia, Spain). When there were significant differences between the delineations, both radiologists agreed the consensus prostate segmentation mask considered the ground truth to train the model. All annotations were performed on a slice-by-slice basis using ITK-SNAP tool [15].
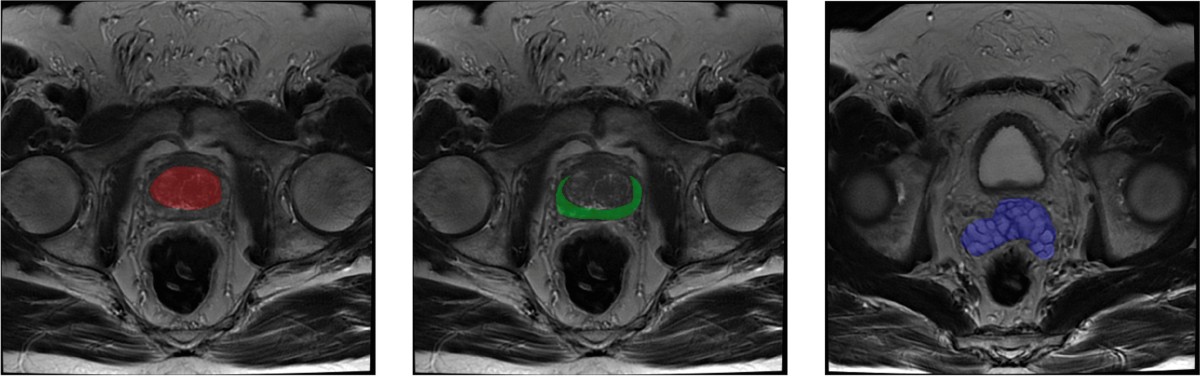
Fig. 2. Ground truth labels manually segmented by an expert. Three regions were segmented in the images: CZ-TZ (red), PZ (green), and SV (blue).
Testing dataset
The testing set included 120 T2-weighted MR images (3168 2D images) received and segmented between November 2019 and April 2020. No patients overlapped across the training and testing sets. The delineations of CZ-TZ, PZ, and SV were performed by the same 2 radiologists following the identical procedure described for the training and tuning sets. The origin of the test database is described in Table 3. A New York medical institution was added for external validation; cases from this institution were not included in the training dataset.
Network architecture
An architecture based in U-Net [16] was used in this experiment. To improve the performance of the model, a deep supervision stage [17] was added which applied a 1 × 1 convolutional filter to the outputs of the decoder blocks to combine them with the output of the network to force earlier layers to provide activation maps closer to the desired segmentation (Fig. 3). To train this network, the inverse of the Dice score coefficient (DSC) was used as cost function and Adam as optimization algorithm [18] along 300 epochs dividing the data in batches of 100 2D input slices of 256 × 256 and their respective segmentation masks of 256 × 256 × 4 (one channel per class).
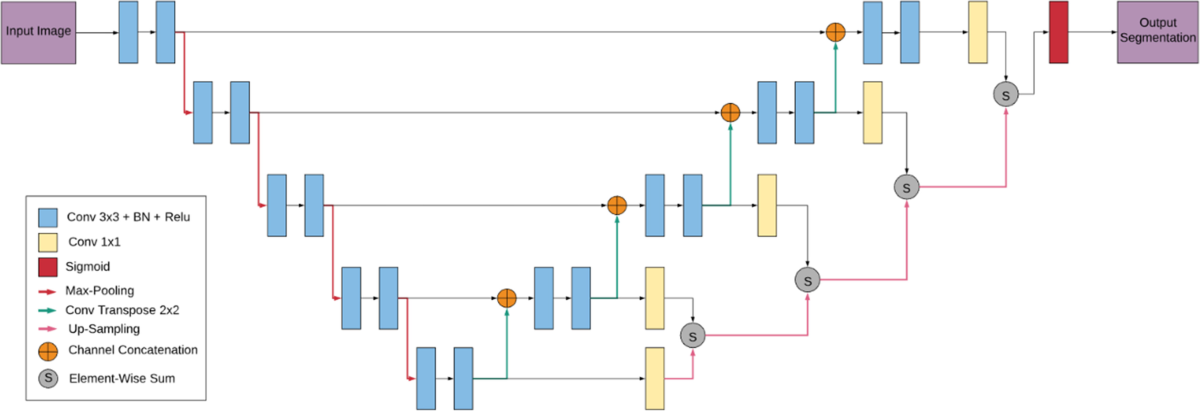
Fig. 3. Deeply supervised U-Net architecture.
Training process
Pre-processing
To achieve a balance between resolution and computational load, all the 2D images were resized to common size of 256 × 256. Then, all the images were intensity-normalized to the interval [0, 1] to reduce intensity range, which is required by CNNs. During training, random data augmentation transformations were used to produce slightly different batches of data to improve the model's performance and generalization [19]. The transformations applied to the images consisted of Gaussian noise addition of standard deviation varying in the interval [0, 0.08], rotation in the range of [−15, 15] degrees and left–right flip. The probability that a specific transformation was applied to a given image was 30% in each data augmentation iteration.
Cyclical learning rate
To avoid the time-consuming task of learning rate fine-tuning, a cyclical learning rate [20] methodology was used. To find the reasonable bounds of the cycle, the model was trained with a few epochs using incremental learning rates. The lower bound was considered the learning rate where the loss function started to decrease and the upper bound the learning rate that produced the minimum value of the loss function [20].
Post-processing
To avoid randomly mislabeled pixels and background-labeled pixels, morphological operators [21] were applied, consisting of a per-class opening and a black hat to the combination of the CZ-TZ and PZ masks, that was used to find the background-labeled pixels, which were assigned as CZ-TZ pixels afterwards (Fig. 4).
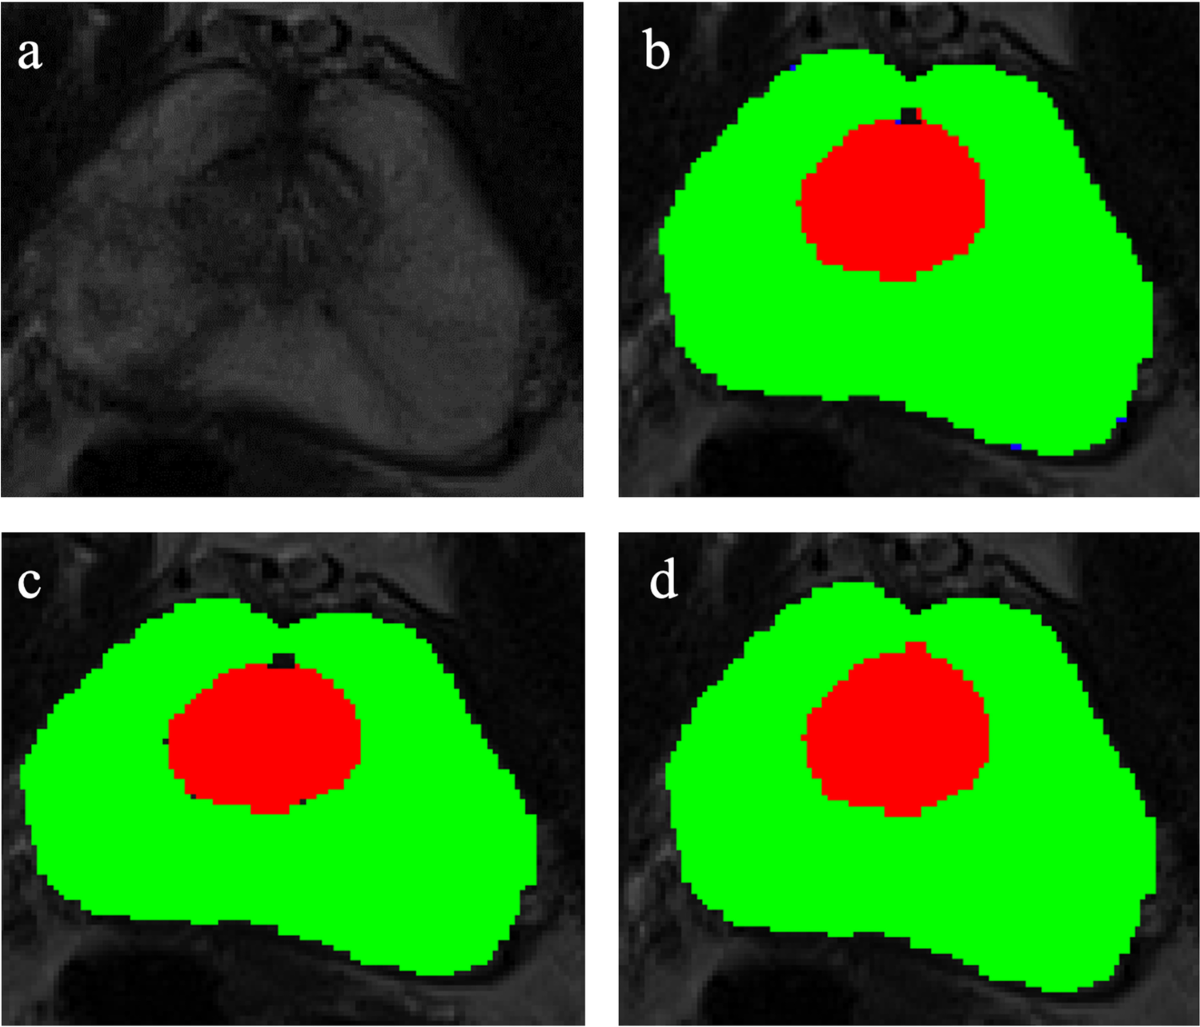
Fig. 4. Segmentation mask post-processing process. a Prostate T2-weighted MRI without segmentation mask. b Output segmentation of the proposed model, some noisy segmented voxels can be found in the border areas. c Output segmentation after removing the noisy segmented regions. d Output segmentation with closed borders (final segmentation).
Performance metrics evaluation
To evaluate the performance of the CNN, complementary boundary-based, regional overlap-based, and volume-based metrics were evaluated using the 120 studies that composed the test set. The mean absolute distance was used as the boundary-based error metric; the 3D DSC, recall rate, and precision rate as regional overlap-based error metrics; and the volume difference (ΔV) in cm³ as volume-based metric. These metrics were used to compare the automated multi-regional segmentation against the manual segmentation. The metrics were extracted independently for the CZ-TZ, PZ, SV, and PG. To evaluate the generalization of the model, the metrics were obtained for studies of the test set as whole and, independently, for the studies of the test set acquired in the USA (not used for model training) and for the studies of the test set acquired with scanners from the different manufacturers (GE, Siemens, and Philips). To analyze for statistically significant differences between the USA cohort and the rest, the Mann–Whitney U test was used based after evaluating the non-Gaussian distribution of the obtained metrics with the Shapiro–Wilk test. Finally, to compare results between the three manufacturers, the Kruskal Wallis test was conducted.
Experiments and results
Cyclic learning rate
The obtained learning rate cycle bounds were 10−4 and 10−2. The method chosen to vary the learning rate cyclically was a triangular function that scaled its peak with a gamma factor of 0.99994 each time 8 batches of training data were passed through the network (Fig. 5).
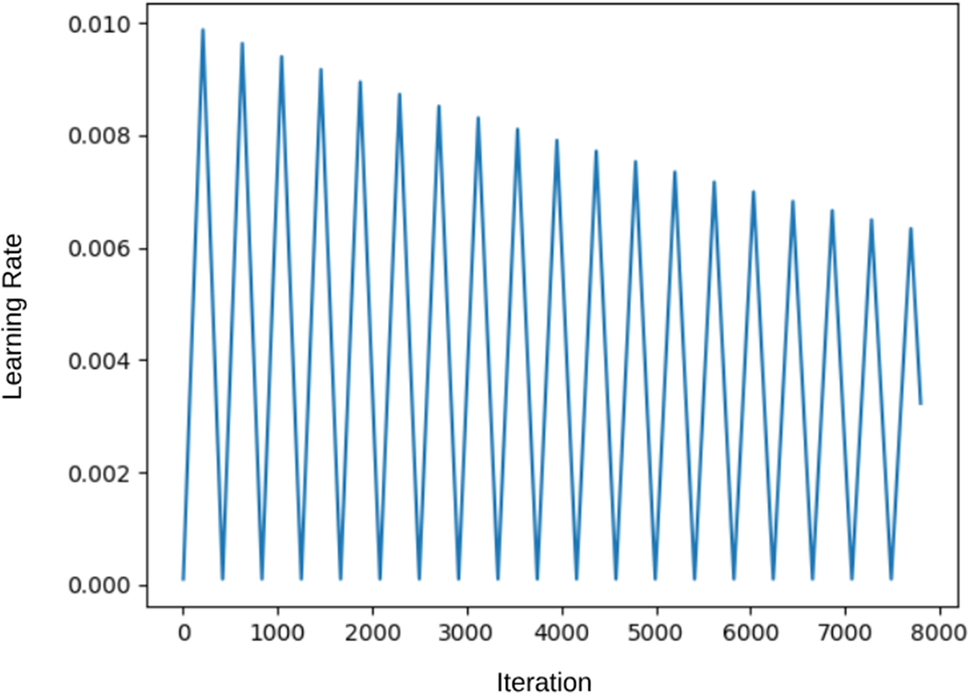
Fig. 5. Cyclical learning rate evolution over model training, each iteration is a forward–backward evaluation of a training set batch.
Metrics
The metrics obtained for the whole test set can be seen in Table 4. The PG was segmented with an average DSC of 0.88 ± 0.01 (DSC of 0.85 ± 0.02 for the CZ-TZ and of 0.72 ± 0.02 for the PZ), and the SV was segmented with a DSC of 0.72 ± 0.02. For the results presented in Table 4, similar results can be observed between the ones obtained over the whole testing dataset and those from the subset of the USA (0.88 ± 0.01 DSC in PG segmentation). No statistically significant differences (p > 0.05) were found between the metrics in the USA cases and the ones obtained in the rest of the test dataset.
When evaluating the results over scans from different manufacturers, the best results were obtained for images acquired with Siemens scanners (0.88 ± 0.02 DSC in PG segmentation), obtaining slightly lower results with Philips scanners (0.86 ± 0.07 DSC in PG segmentation). No statistically significant differences (p > 0.05) were found between the results obtained among the three manufacturers.
Table 4. Metrics obtained with the automatic prostate multi-regional segmentation CNN in the studies of the whole test set, the studies acquired in the USA, the test studies acquired with GE equipment, the test studies acquired with Siemens equipment, and the test studies acquired with Philips equipment. For each metric the mean ± standard deviation values are provided
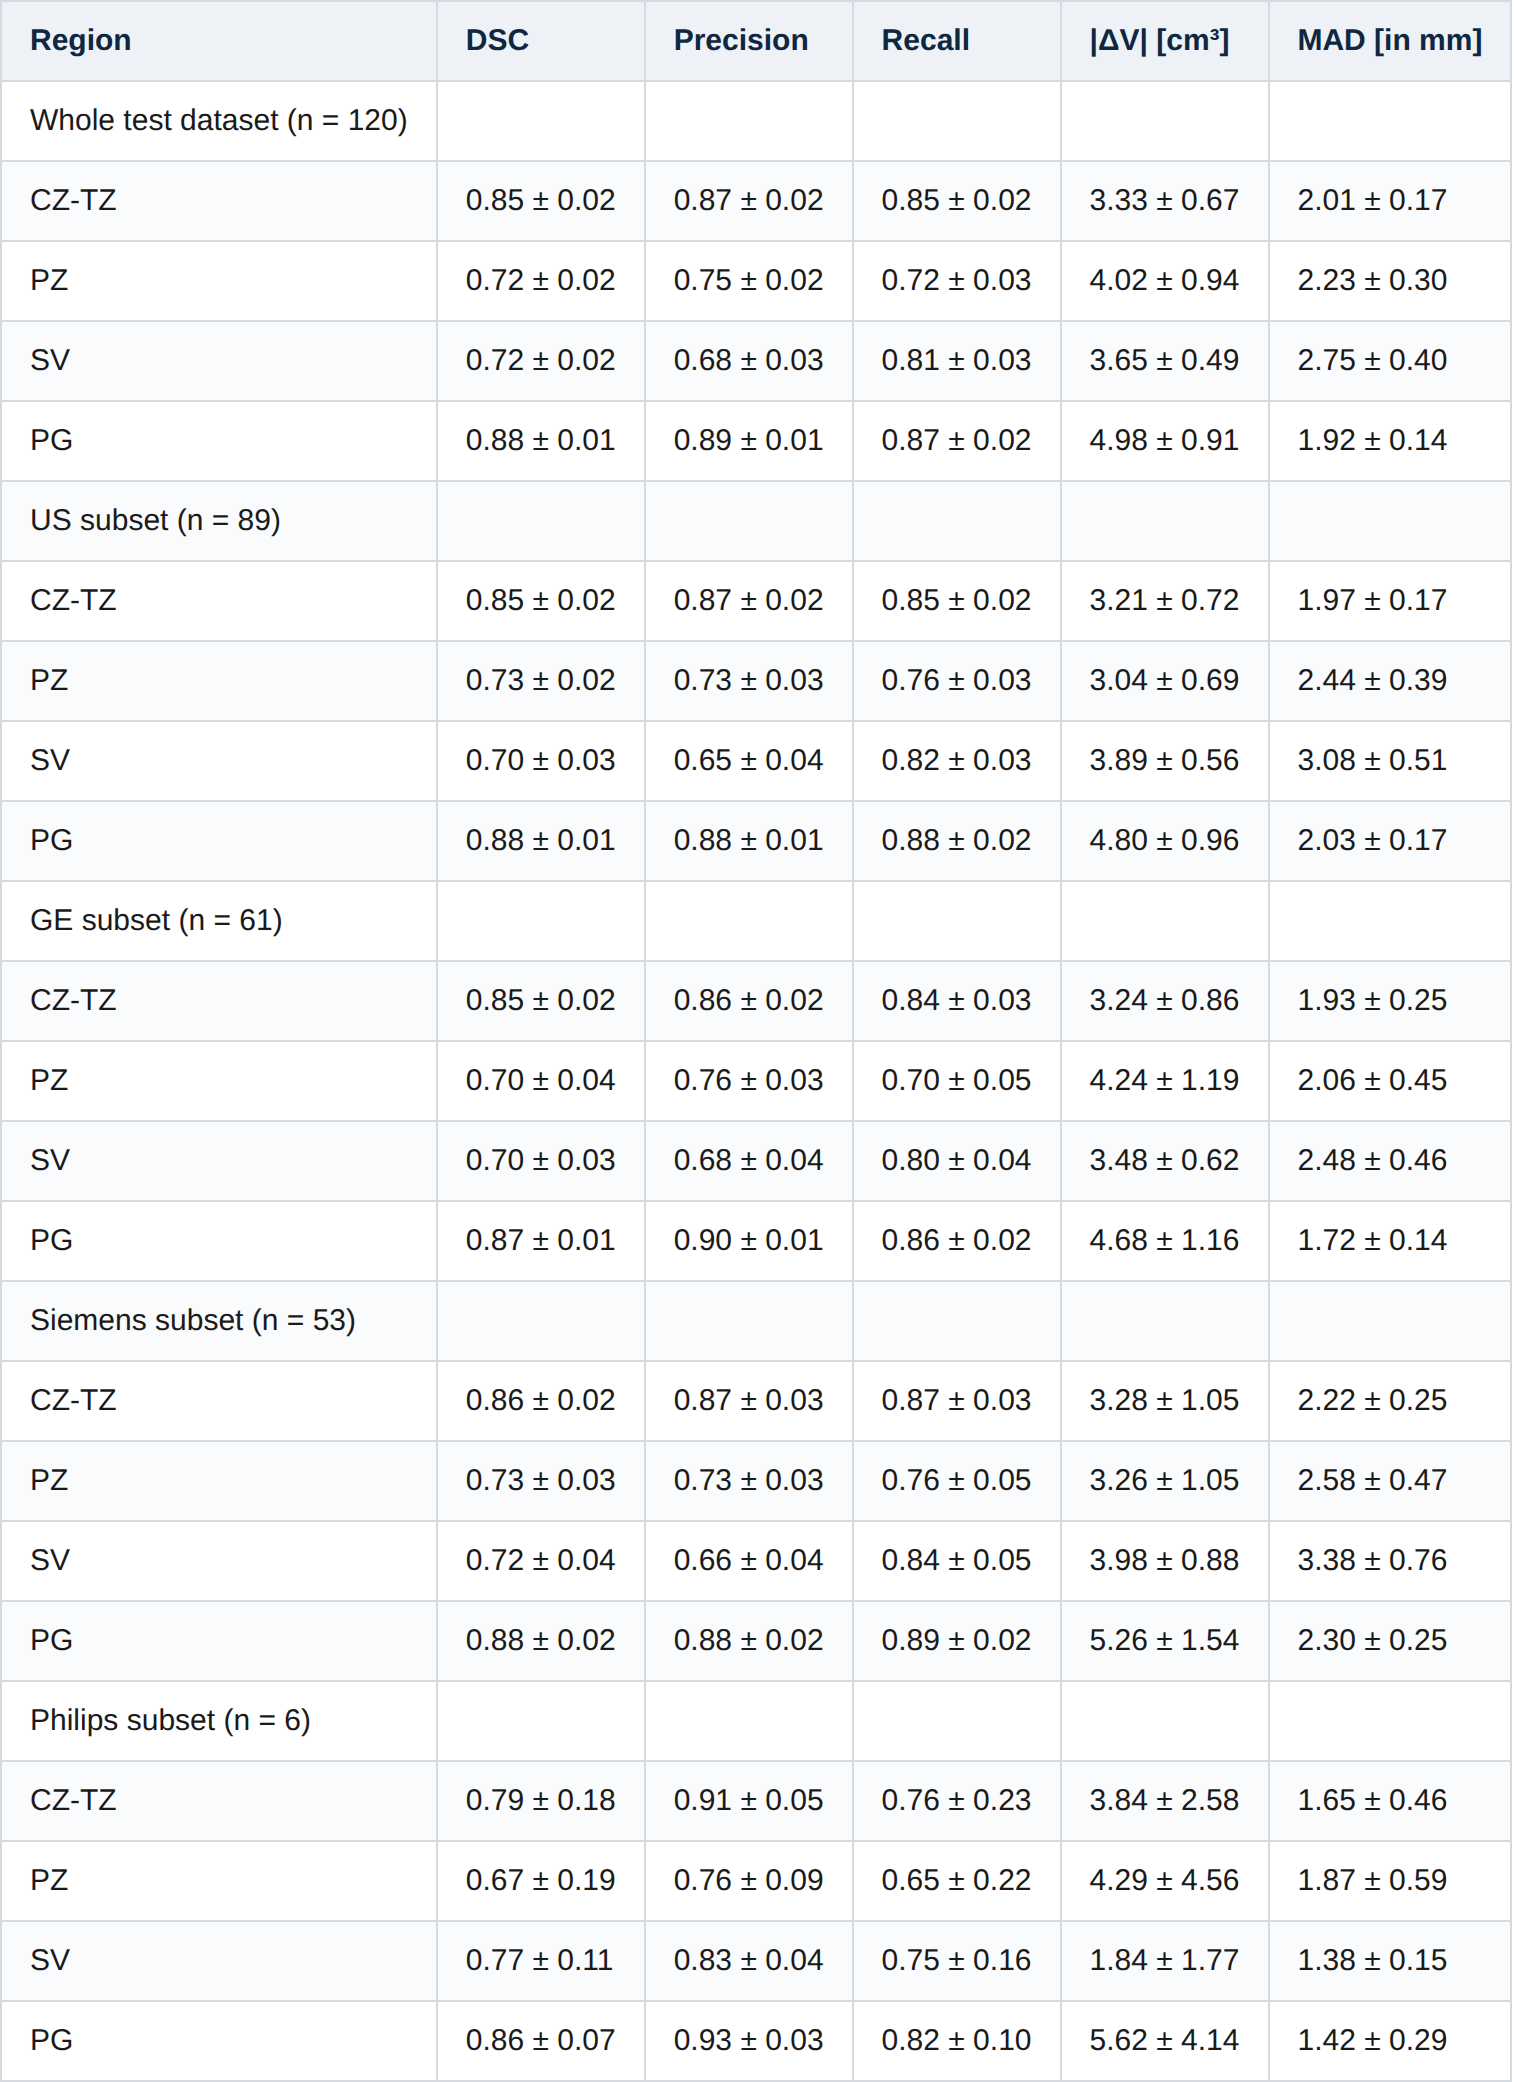
Figure 6 shows the results obtained in 2 test patients, one showing the case where the worst DC for the PG segmentation was obtained and another one where a good result was obtained for all the labels.
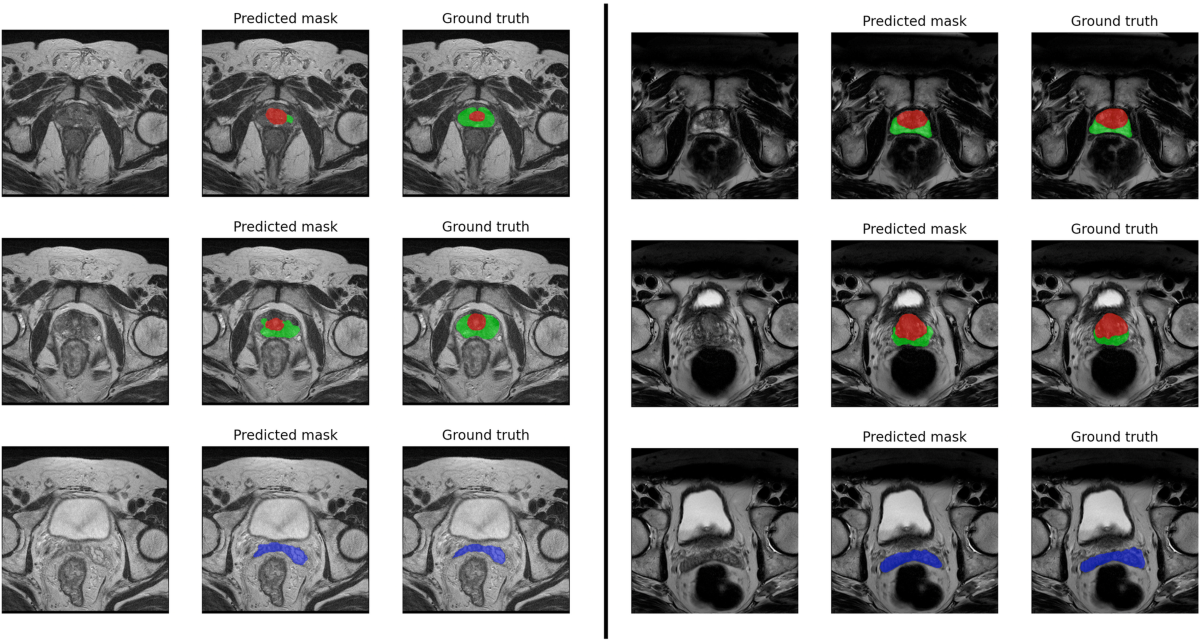
Fig. 6. Segmentation obtained in two test cases. In both cases, three different slices are shown at different prostate levels. For each slice, the original MR image (left), the predicted mask (middle), and the ground truth (right) are shown. The CZ + TZ is represented in red, the PZ in green, and the SV in blue. The left example shows the performance of the model in a case from the test set where the worst performance was observed in the PG segmentation (DSC = 0.64). The right example shows an example with good performance for all the labels.
Execution time
The experiments were executed on a high computing performance node with 2 processors Intel SkyLake 6132 Gold 2.6 GHz with 14 cores, 2 GPUs NVIDIA QUADRO GP100 of 16 GB, and 192 GB of RAM memory running CentOS 7. TensorFlow was the deep learning framework used to run the experiments, and Keras was used as interface to speed up the code development. During the training process, the average epoch time was 44 s.
The inference time was measured on a MacBook Pro of 2018 with an Intel Core i7 2.6 GHz with 6 cores, a GPU Radeon Pro 560X of 4 GB, and 16 GB of RAM memory running macOS Big Sur. The average inference time over the test set was 0.46 s/slice including the pre-processing and post-processing.
Discussion
An automated prostate multi-regional segmentation algorithm based in a fully convolutional CNN with T2-weighted MRI as the input was proposed and externally validated in the present manuscript. The model was built from studies across 10 different MRI systems from 7 different countries and 3 vendors.
It is broadly accepted in training DL robust models that datasets must be carefully built to represent variability within the domain of the problem. MRI properties are affected by multiple factors such as scanner model and technical acquisition parameters. Due to these factors and the accessibility of fast spin-echo T2-weighted MRI, this sequence was the preferred one for the development of the segmentation model over other sequences such as DWI and DCE. This variability has a significant impact in the performance of DL models if diversity is not represented in the training dataset due to the difficulties of gathering medical imaging data from multiple sources [11]. Additionally, to properly test DL models in the medical domain, an independent database must be collected [22]. The use of a non-exposed independent database to validate the algorithms ensures that their biases based on the acquisition machine manufacturer or acquisition parameters are minimized. Following these, highly heterogeneous intercontinental training and testing standard-of-care prostate MRI examination databases were collected to undertake this development.
As derived from the results obtained in the testing database, the prostate segmentation resulted in higher DSC, most likely due to its larger size, homogeneity, and roundness, whereas the SV provided the lower DSC due to its smaller size and larger variability across individuals, factors that have a significant impact in the DSC calculation. The performance of the proposed method for automated gland segmentation is comparable with manual performance by expert observers [23, 24]. We obtained DSC of 0.88 ± 0.01 in PG segmentation, whereas [23] obtained a DSC ranging from 0.74 to 0.90 (mean and confidence range were not provided) when comparing manual prostate segmentations in T2-weighted MR images among three expert observers, and [24] obtained a DSC of 0.74 ± 0.14 when comparing the segmentations between six readers. Therefore, the results obtained in this work are within the ranges to be used in clinical practice, since they are comparable with those obtained by experts. According to these previous references, we can consider, therefore, a threshold of DSC over 0.7 as an accurate segmentation result.
The performance of our prostate segmentation method was compared (Table 5) with the results of recent similar methods [6, 7, 12, 13, 25–27]. The best performing algorithm [12] had a DSC of 0.94, 0.91, and 0.77 for PG, CZ-TZ, and PZ, respectively; in comparison, we obtained a DSC of 0.88 ± 0.01, 0.85 ± 0.02, and 0.72 ± 0.01.
Table 5. Comparison of the proposed method with other prostate segmentation studies
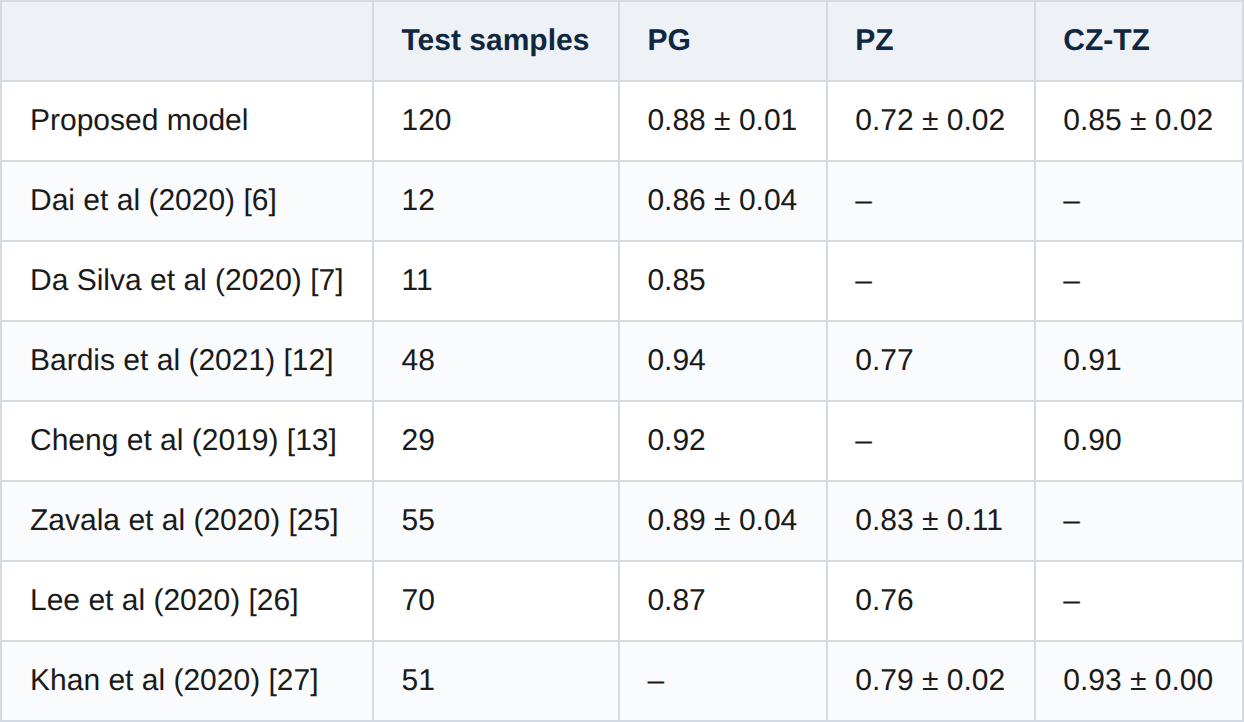
A direct comparison with these other proposed methods is difficult due to the test data variability in terms of number, quality, and size of the images. None of previous studies presented a database as large and heterogeneous as the one collected in this publication, nor did they include the segmentation of the SV. In the study [12], even though better results were obtained for all the structures, it is important to highlight that it was validated with only 48 cases coming from 2 MRI scanner models at one institution; therefore, a direct comparison between both methods should be made in future study.
Additionally, the training set of this work was acquired with the same equipment and acquisition protocols as the test set. The test set proposed in the present work is significantly larger, collected from several institutions, resulting in more robust DL models given the higher variability present. The test set used in our study represents more accurately the real-world data.
Our method presents some limitations that should be considered. As a 2D CNN has been used, the prostate regions are not evaluated as a whole 3D structure, but in a slice-by-slice manner which may have impact in the regularity of the segmentation along the axial axis. The size of the T2-weighted slices was decreased to 256 × 256 for memory and speed constraints, which may lead to information loss affecting the segmentation performance. Furthermore, the database used for the present work is composed of 243 studies coming from different sources with high variability, which is a very large size for the medical domain and one of the main values of the present work; but on the other hand, it is a moderate size for DL approaches; therefore, increasing the size of the database will lead to better results. Finally, further research and validations should be conducted to compare our automatic method against expert manual segmentation to probe that our methods give comparable results.
Conclusion
In summary, prostate multi-regional T2-weighted segmentations can be properly achieved in MRI studies by U-Net like CNNs. The obtained results are generalizable in the highly variable clinical environment with different equipment, acquisition configurations, and patient's population. The results demonstrate that DL approaches are suitable to not just segment the prostate gland but to differentiate the CZ-TZ and PZ that compose it and additionally identify the SV. This automatic approach can aid radiologists in the evaluation of prostate cancer behavior following the PIRADS guidelines, and accurately evaluate clinically significant cancer in the prostate following the PIRADS v2.1 guidelines.