Federated learning for predicting clinical outcomes in patients with COVID-19
Summary
Federated learning (FL) is a method used for training artificial intelligence models with data from multiple sources while maintaining data anonymity, thus removing many barriers to data sharing. Here we used data from 20 institutes across the globe to train a FL model, called EXAM (electronic medical record (EMR) chest X-ray AI model), that predicts the future oxygen requirements of symptomatic patients with COVID-19 using inputs of vital signs, laboratory data and chest X-rays. EXAM achieved an average area under the curve (AUC) >0.92 for predicting outcomes at 24 and 72 h from the time of initial presentation to the emergency room, and it provided 16% improvement in average AUC measured across all participating sites and an average increase in generalizability of 38% when compared with models trained at a single site using that site’s data. For prediction of mechanical ventilation treatment or death at 24 h at the largest independent test site, EXAM achieved a sensitivity of 0.950 and specificity of 0.882. In this study, FL facilitated rapid data science collaboration without data exchange and generated a model that generalized across heterogeneous, unharmonized datasets for prediction of clinical outcomes in patients with COVID-19, setting the stage for the broader use of FL in healthcare.
Main
The scientific, academic, medical and data science communities have come together in the face of the COVID-19 pandemic crisis to rapidly assess novel paradigms in artificial intelligence (AI) that are rapid and secure, and potentially incentivize data sharing and model training and testing without the usual privacy and data ownership hurdles of conventional collaborations 1 , 2 . Healthcare providers, researchers and industry have pivoted their focus to address unmet and critical clinical needs created by the crisis, with remarkable results 3 , 4 , 5 , 6 , 7 , 8 , 9 . Clinical trial recruitment has been expedited and facilitated by national regulatory bodies and an international cooperative spirit 10 , 11 , 12 . The data analytics and AI disciplines have always fostered open and collaborative approaches, embracing concepts such as open-source software, reproducible research, data repositories and making available anonymized datasets publicly 13 , 14 . The pandemic has emphasized the need to expeditiously conduct data collaborations that empower the clinical and scientific communities when responding to rapidly evolving and widespread global challenges. Data sharing has ethical, regulatory and legal complexities that are underscored, and perhaps somewhat complicated, by the recent entrance of large technology companies into the healthcare data world 15 , 16 , 17 .
A concrete example of these types of collaboration is our previous work on an AI-based SARS-COV-2 clinical decision support (CDS) model. This CDS model was developed at Mass General Brigham (MGB) and was validated across multiple health systems’ data. The inputs to the CDS model were chest X-ray (CXR) images, vital signs, demographic data and laboratory values that were shown in previous publications to be predictive of outcomes of patients with COVID-19 18 , 19 , 20 , 21 . CXR was selected as the imaging input because it is widely available and commonly indicated by guidelines such as those provided by ACR 22 , the Fleischner Society 23 , the WHO 24 , national thoracic societies 25 , national health ministry COVID handbooks and radiology societies across the world 26 . The output of the CDS model was a score, termed CORISK 27 , that corresponds to oxygen support requirements and that could aid in triaging patients by frontline clinicians 28 , 29 , 30 . Healthcare providers have been known to prefer models that were validated on their own data 27 . To date most AI models, including the aforementioned CDS model, have been trained and validated on ‘narrow’ data that often lack diversity 31 , 32 , potentially resulting in overfitting and lower generalizability. This can be mitigated by training with diverse data from multiple sites without centralization of data 33 using methods such as transfer learning 34 , 35 or FL. FL is a method used to train AI models on disparate data sources, without the data being transported or exposed outside their original location. While applicable to many industries, FL has recently been proposed for cross-institutional healthcare research 36 .
Federated learning supports the rapid launch of centrally orchestrated experiments with improved traceability of data and assessment of algorithmic changes and impact 37 . One approach to FL, called client-server, sends an ‘untrained’ model to other servers (‘nodes’) that conduct partial training tasks, in turn sending the results back to be merged in the central (‘federated’) server. This is conducted as an iterative process until training is complete 36 .
Governance of data for FL is maintained locally, alleviating privacy concerns, with only model weights or gradients communicated between client sites and the federated server 38 , 39 . FL has already shown promise in recent medical imaging applications 40 , 41 , 42 , 43 , including in COVID-19 analysis 8 , 44 , 45 . A notable example is a mortality prediction model in patients infected with SARS-COV-2 that uses clinical features, albeit limited in terms of number of modalities and scale 46 .
Our objective was to develop a robust, generalizable model that could assist in triaging patients. We theorized that the CDS model can be federated successfully, given its use of data inputs that are relatively common in clinical practice and that do not rely heavily on operator-dependent assessments of patient condition (such as clinical impressions or reported symptoms). Rather, laboratory results, vital signs, an imaging study and a commonly captured demographic (that is, age), were used. We therefore retrained the CDS model with diverse data using a client-server FL approach to develop a new global FL model, which was named EXAM, using CXR and EMR features as input. By leveraging FL, the participating institutions would not have to transfer data to a central repository, but rather leverage a distributed data framework.
Our hypothesis was that EXAM would perform better than local models and would generalize better across healthcare systems.
Results
The EXAM model architecture
The EXAM model is based on the CDS model mentioned above 27 . In total, 20 features (19 from the EMR and one CXR) were used as input to the model. The outcome (that is, ‘ground truth’) labels were assigned based on patient oxygen therapy after 24- and 72-hour periods from initial admission to the emergency department (ED). A detailed list of the requested features and outcomes can be seen in Table 1 .
Table 1 |: EMR (electronic medical record) data used in the EXAM study
| Category | Subcategory | Component Name | Definition | Units | LOINC Code |
|---|---|---|---|---|---|
| Demographic | - | Patient Age | - | Years | 30525–0 |
| Imaging | Portable Chest X-Ray | - | AP or PA Portable Chest X-ray | - | 36554–4 |
| Lab Value | C-Reactive Protein | C Reactive Protein | Blood C-Reactive Protein Concentration | mg/L | 1988–5 |
| Lab Value | CBC (Complete Blood Count) | Neutrophils | Blood Absolute Neutrophils | 10^9/L | 751–8 |
| Lab Value | CBC (Complete Blood Count) | White Blood Cells | Blood White Blood Cell Count | 10^9/L | 33256–9 |
| Lab Value | D-Dimer | D-Dimer | Blood D-Dimer Concentration | ng/mL | 7799–0 |
| Lab Value | Lactate | Lactate | Blood Lactate Concentration | mmol/L | 2524–7 |
| Lab Value | LDH (Lactate Dehydrogenase) | LDH | Blood Lactate Dehydrogenase Concentration | U/L | 2532–0 |
| Lab Value | Metabolic Panel | Creatinine | Blood Creatinine Concentration | mg/dL | 2160–0 |
| Lab Value | Procalcitonin | Procalcitonin | Blood Procalcitonin Concentration | ng/mL | 33959–8 |
| Lab Value | Metabolic Panel | eGFR | Estimated Glomerular Filtration Rate | mL/min/1.73m2 | 69405–9 |
| Lab Value | Troponin | Troponin-T | Blood Troponin Concentration | ng/ml | 67151–1 |
| Lab Value | Hepatic Panel | AST | Blood AST Concentration | IU/L | 1920–8 |
| Lab Value | Metabolic Panel | Glucose | Blood Glucose Concentration | mg/dL | 2345–7 |
| Vital Sign | - | Oxygen Saturation | Oxygen Saturation | % | 59408–5 |
| Vital Sign | - | Systolic Blood Pressure | Systolic Blood Pressure | mmHg | 8480–6 |
| Vital Sign | - | Diastolic Blood Pressure | Diastolic Blood Pressure | mmHg | 8462–4 |
| Vital Sign | - | Respiratory Rate | Respiratory Rate | breaths per minute | 9279–1 |
| Vital Sign | COVID PCR test | PCR for RNA [not used as input to model] | 95425–5 | ||
| Vital Sign | Oxygen Device used at Emergency Department (ED) | Oxygen Device | Ventilation, High-flow/NIV, Low-flow, Room Air | - | 41925–9 |
| Outcome | 24Hr Oxygen Device | Oxygen Device | Ventilation, High-flow/NIV, Low-flow, Room Air | - | 41925–9 |
| Outcome | 72Hr Oxygen Device | Oxygen Device | Ventilation, High-flow/NIV, Low-flow, Room Air | - | 41925–9 |
| Outcome | Death | - | - | - | - |
| Outcome | Time of Death | - | - | Hours | - |
The outcome labels of patients were set to 0, 0.25, 0.50 and 0.75 depending on the most intensive oxygen therapy the patient received in the prediction window. The oxygen therapy categories were, respectively, room air (RA), low-flow oxygen (LFO), high-flow oxygen (HFO)/noninvasive ventilation (NIV) or mechanical ventilation (MV). If the patient died within the prediction window, the outcome label was set to 1. This resulted in each case being assigned two labels in the range 0–1, corresponding to each of the prediction windows (that is, 24 and 72 h).
For EMR features, only the first values captured in the ED were used and data preprocessing included deidentification, missing value imputation and normalization to zero-mean and unit variance. For CXR images, only the first obtained in the ED was used.
The model therefore fuses information from both EMR and CXR features, using a 34-layer convolutional neural network (ResNet34) to extract features from a CXR and a Deep & Cross network to concatenate the features together with the EMR features (for more expanded details, see Methods ). The model output is a risk score, termed the EXAM score, which is a continuous value in the range 0–1 for each of the 24- and 72-hour predictions corresponding to the labels described above.
Federating the model
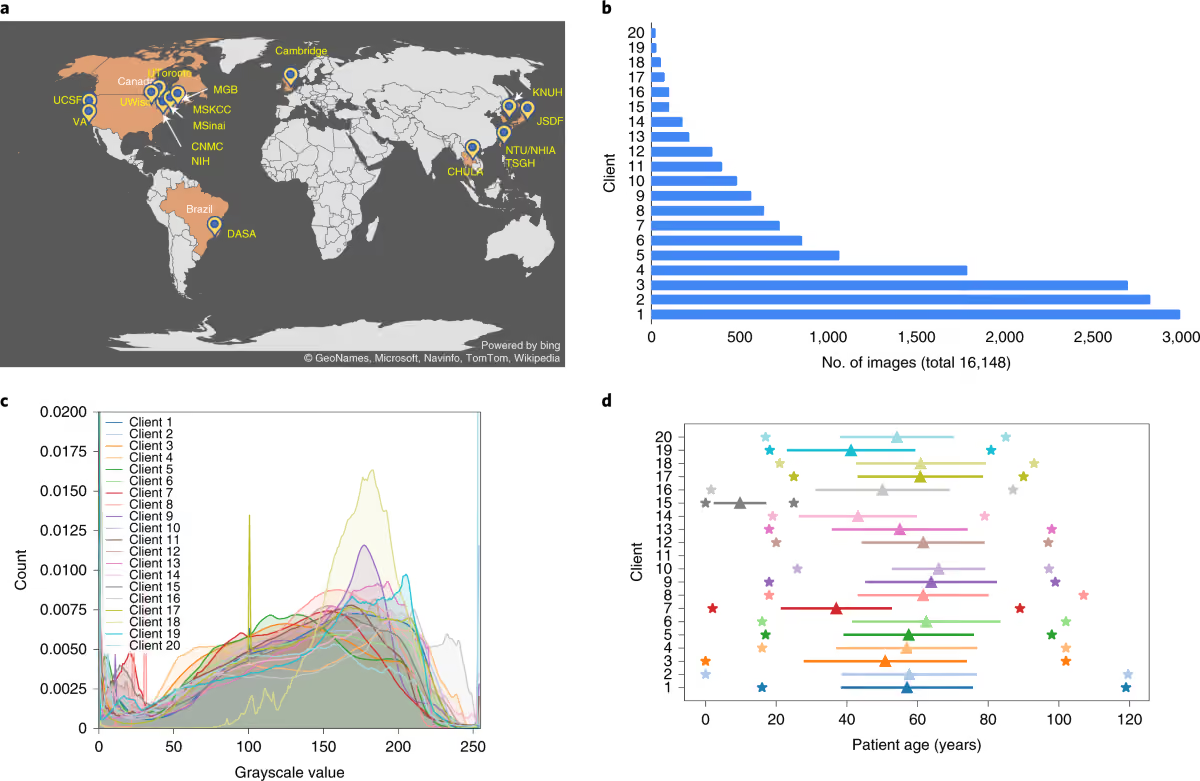
The EXAM model was trained using a cohort of 16,148 cases, making it not only among the first FL models for COVID-19 but also a very large and multicontinent development project in clinically relevant AI (Fig. 1a,b ). Data between sites were not harmonized before extraction and, in light of real-life clinical informatics circumstances, a meticulous harmonization of the data input was not conducted by the authors (Fig. 1c,d ).
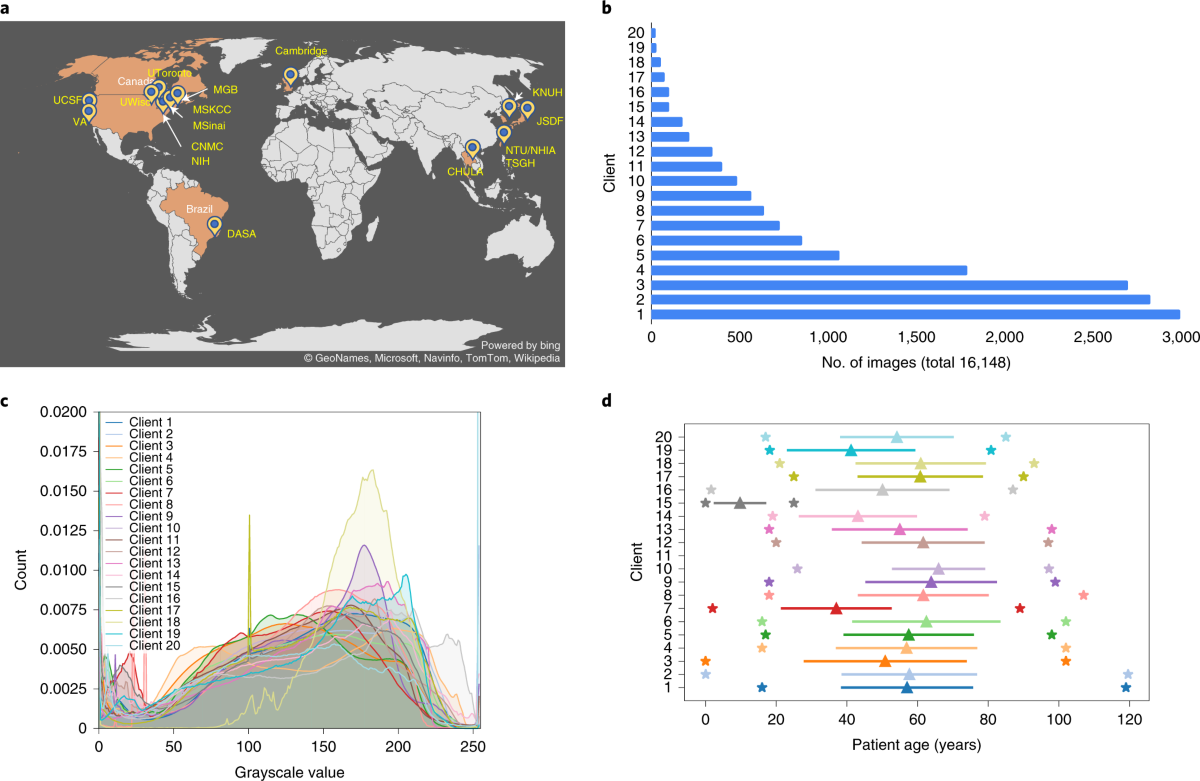
Fig. 1: Data used in the EXAM FL study.
a , World map indicating the 20 different client sites contributing to the EXAM study. b , Number of cases contributed by each institution or site (client 1 represents the site contributing the largest number of cases). c , Chest X-ray intensity distribution at each client site. d , Age of patients at each client site, showing minimum and maximum ages (asterisks), mean age (triangles) and standard deviation (horizontal bars). The number of samples of each client site is shown in Supplementary Table 1 .
We compared locally trained models with the global FL model on each client’s test data. Training the model through FL resulted in a significant performance improvement ( P « 1 × 10 –3 , Wilcoxon signed-rank test) of 16% (as defined by average AUC when running the model on respective local test sets: from 0.795 to 0.920, or 12.5 percentage points) (Fig. 2a ). It also resulted in 38% generalizability improvement (as defined by average AUC when running the model on all test sets: from 0.667 to 0.920, or 25.3 percentage points) of the best global model for prediction of 24-h oxygen treatment compared with models trained only on a site’s own data (Fig. 2b ). For the prediction results of 72-h oxygen treatment, the best global model training resulted in an average performance improvement of 18% compared to locally trained models, while generalizability of the global model improved on average by 34% (Extended Data Fig. 1 ). The stability of our results was validated by repeating three runs of local and FL training on different randomized data splits.
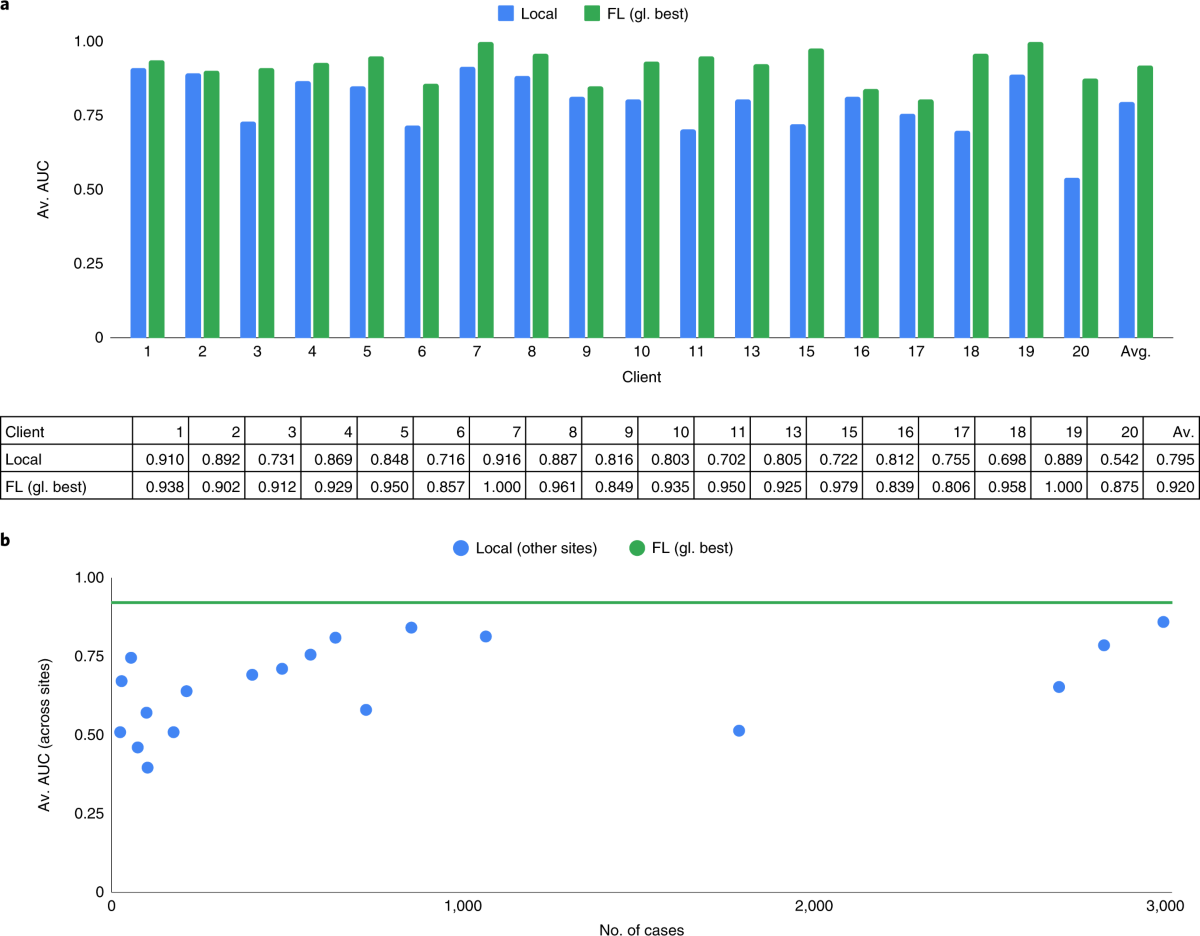
Fig. 2: Performance of FL versus local models.
a , Performance on each client’s test set in prediction of 24-h oxygen treatment for models trained on local data only (Local) versus that of the best global model available on the server (FL (gl. best)). Av., average test performance across all sites. b , Generalizability (average performance on other sites’ test data, as represented by average AUC) as a function of a client’s dataset size (no. of cases). The green horizontal line denotes the generalizability performance of the best global model. The performance for 18 of 20 clients is shown, because client 12 had outcomes only for 72-h oxygen (Extended Data Fig. 1 ) and client 14 had cases only with RA treatment, such that the evaluation metric (av. AUC) was not applicable in either of these cases ( Methods ). Data for client 14 were also excluded from computation of average generalizability in local models.
Local models that were trained using unbalanced cohorts (for example, mostly mild cases of COVID-19) markedly benefited from the FL approach, with a substantial improvement in prediction average AUC performance for categories with only a few cases. This was evident at client site 16 (an unbalanced dataset), with most patients experiencing mild disease severity and with only a few severe cases. The FL model achieved a higher true-positive rate for the two positive (severe) cases and a markedly lower false-positive rate compared to the local model, both shown in the receiver operating characteristic (ROC) plots and confusion matrices (Fig. 3a and Extended Data Fig. 2 ). More important, the generalizability of the FL model was considerably increased over the locally trained model.
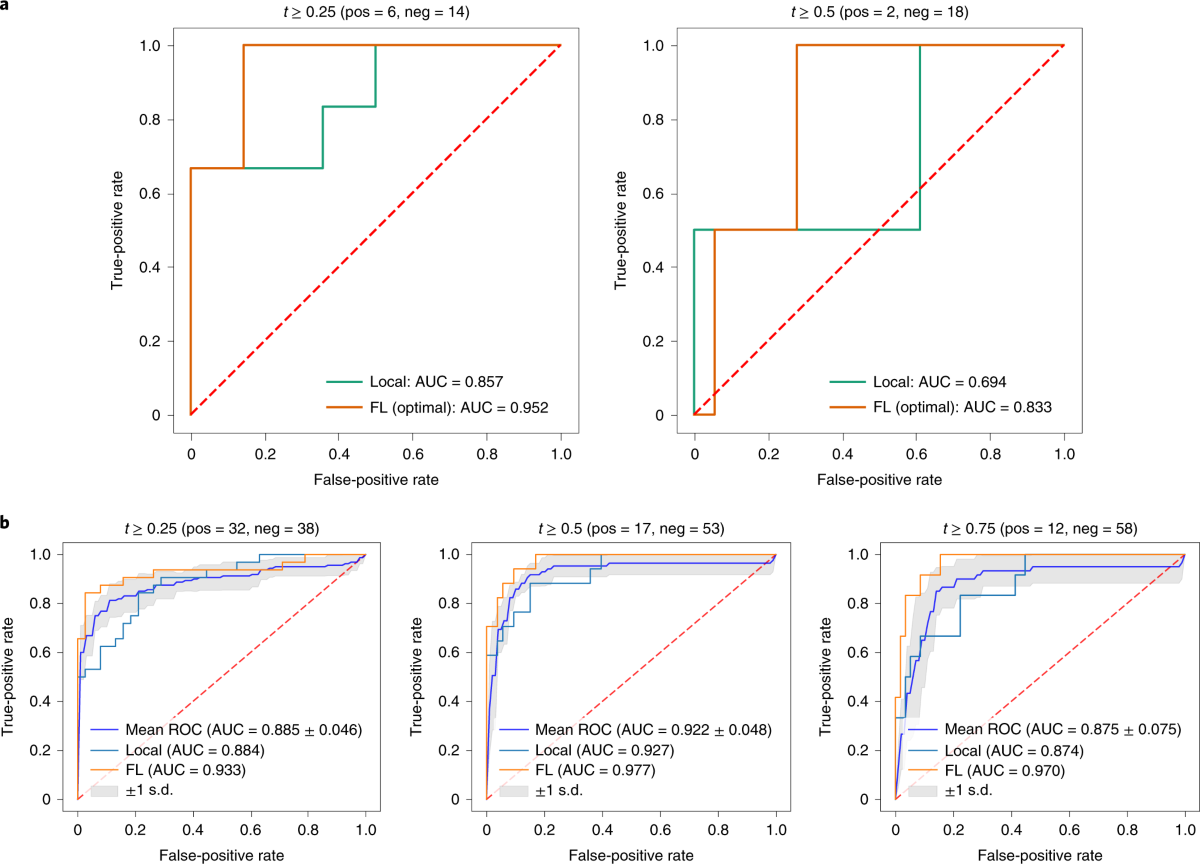
Fig. 3: Comparison of FL- and locally trained models.
a , ROC at client site 16, with unbalanced data and mostly mild cases. b , ROC of the local model at client site 12 (a small dataset), mean ROC of models trained on larger datasets corresponding to the five client sites in the Boston area 1,4,5,6,8 and ROC of the best global model in prediction of 72-h oxygen treatment for different thresholds of EXAM score (left, middle, right). The mean ROC is calculated based on five locally trained models while the gray area denotes the ROC standard deviation. ROCs for three different cutoff values ( t ) of the EXAM risk score are shown. Pos and neg denote the number of positive and negative cases, respectively, as defined by this range of EXAM score.
In the case of client sites with relatively small datasets, the best FL model markedly outperformed not only the local model but also those trained on larger datasets from five client sites in the Boston area of the USA (Fig. 3b ).
The global model performed well in predicting oxygen needs at 24/72 h in patients both COVID positive and negative (Extended Data Fig. 3 ).
Validation at independent sites
Following initial training, EXAM was subsequently tested at three independent validation sites: Cooley Dickinson Hospital (CDH), Martha’s Vineyard Hospital (MVH) and Nantucket Cottage Hospital (NCH), all in Massachusetts, USA. The model was not retrained at these sites and it was used only for validation purposes. The cohort size and model inference results are summarized in Table 2 , and the ROC curves and confusion matrices for the largest dataset (from CDH) are shown in Fig. 4 . The operating point was set to discriminate between nonmechanical ventilation and mechanical ventilation (MV) treatment (or death). The FL global trained model, EXAM, achieved an average AUC of 0.944 and 0.924 for 24- and 72-h prediction tasks, respectively (Table 2 ), which exceeded the average performance among sites used in training EXAM. For prediction of MV treatment (or death) at 24 h, EXAM achieved a sensitivity of 0.950 and specificity of 0.882 at CDH, and a sensitivity of 1.000 specificity of 0.934 at MVH. NCH did not have any cases with MV/death at 24 h. In regard to 72-h MV prediction, EXAM achieved a sensitivity of 0.929 and specificity of 0.880 at CDH, sensitivity of 1.000 and specificity of 0.976 at MVH and sensitivity of 1.000 and specificity of 0.929 at NCH.
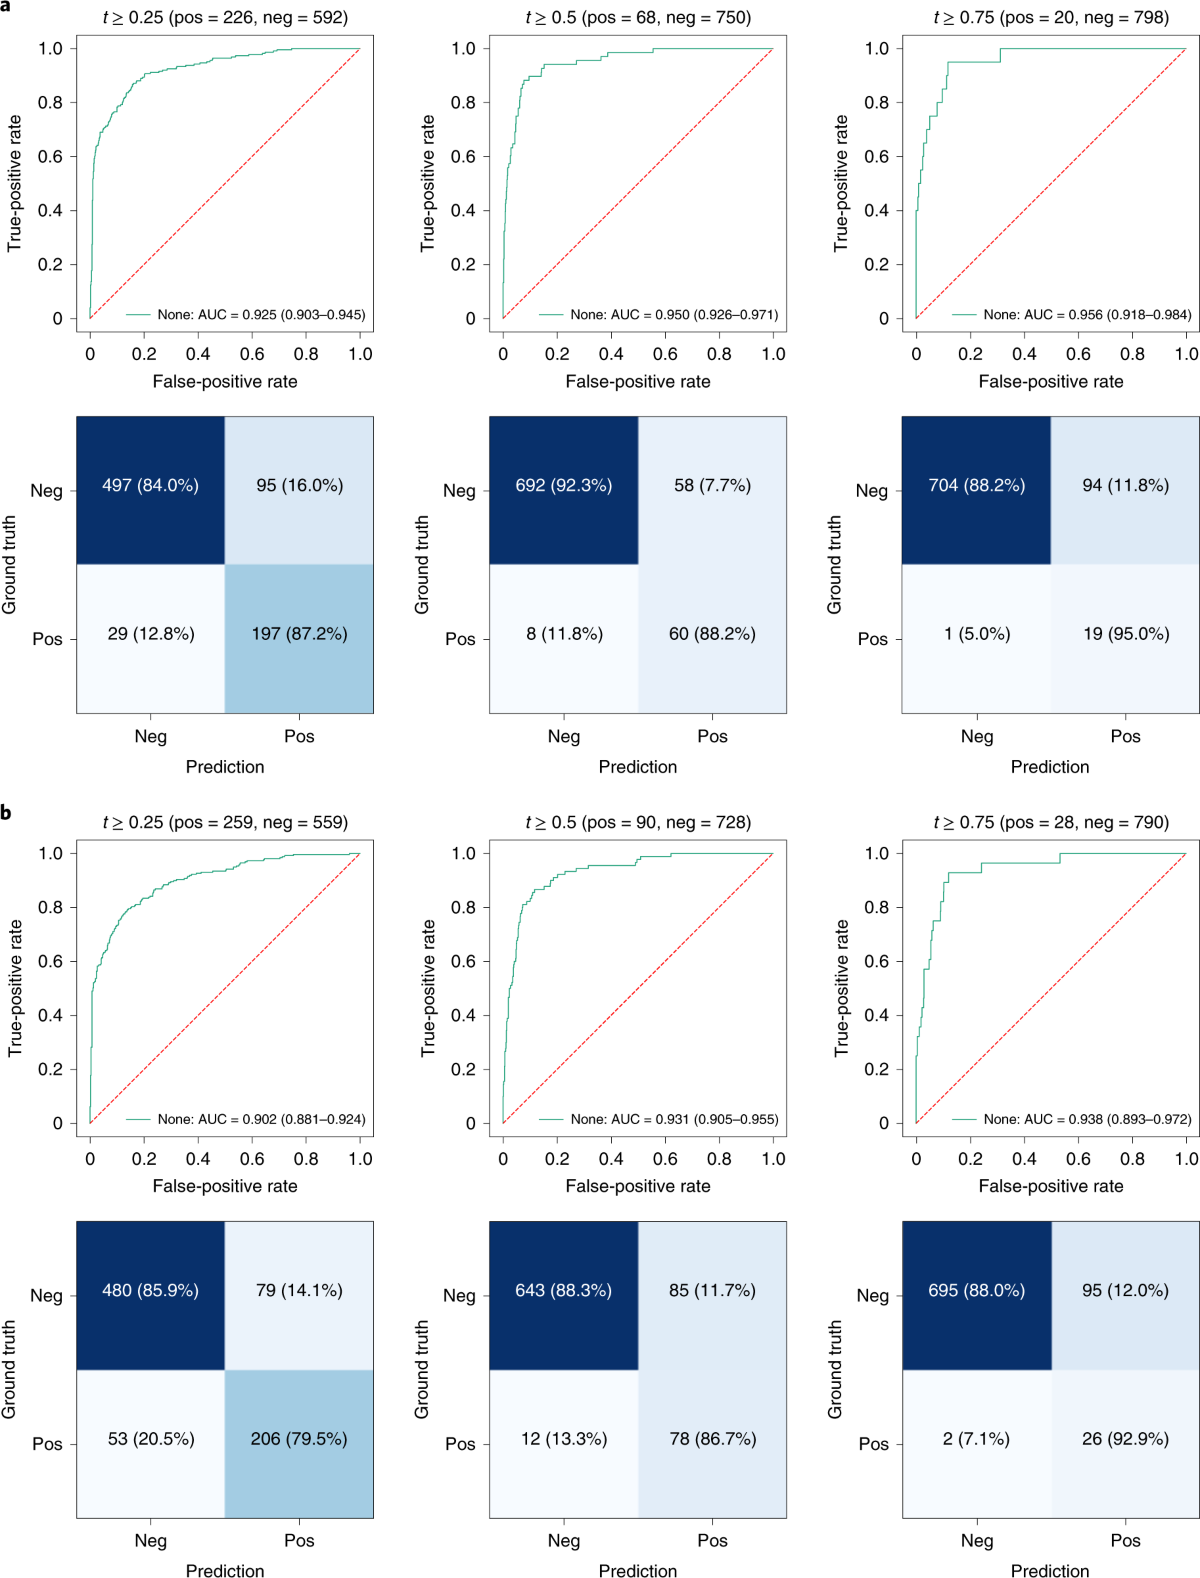
Fig. 4: Performance of the best global model on the largest independent dataset.
Table 2 |: Performance of EXAM on independent data sets. a, Breakdown of patients by level of oxygen needed across the 3 independent datasets, CDH, MVH and NCH. b, AUC for predicting the level of oxygen needed at 24 and 72 h for the 3 independent datasets (with 95% confidence intervals). The AUC for the NCH dataset for MV at 24 h could not be calculated as there were no mechanically ventilated patients. AUC - area under the curve, RA- room air, LFO –low flow oxygen, HFO-NV – high flow oxygen, no mechanical ventilation, MV – mechanical ventilation, #Cases – number of patients included in the data set, # Pos. Cases – number of patients with confirmed COVID-19 infection included in the data set
| a | ||||||||||||
|---|---|---|---|---|---|---|---|---|---|---|---|---|
| Site | # Cases | # Pos. Cases | Prediction Interval | # Patients at each level of Oxygen Needed | ||||||||
| RA | LFO | HFO-NV | MV&DEATH | |||||||||
| CDH | 840 | 244 | 24 hours | 608 | 162 | 48 | 22 | |||||
| 72 hours | 575 | 173 | 62 | 30 | ||||||||
| MVH | 399 | 30 | 24 hours | 356 | 36 | 3 | 4 | |||||
| 72 hours | 351 | 39 | 3 | 6 | ||||||||
| NCH | 264 | 29 | 24 hours | 237 | 23 | 4 | 0 | |||||
| 72 hours | 235 | 22 | 4 | 3 | ||||||||
| b | ||||||||||||
| Site | Prediction Interval | LFO | HFO-NV | MV | Average AUC | |||||||
| CDH | 24 hours | 0.925 (0.903, 0.945) | 0.950 (0.926, 0.971) | 0.956 (0.918, 0.984) | 0.944 | |||||||
| 72 hours | 0.902 (0.881, 0.924) | 0.931 (0.905, 0.955) | 0.938 (0.893, 0.927) | 0.924 | ||||||||
| MVH | 24 hours | 0.904 (0.844, 0.954) | 0.836 (0.620, 0.978) | 0.964 (0.925, 1.000) | 0.901 | |||||||
| 72 hours | 0.887 (0.827, 0.940) | 0.872 (0.663, 0.992) | 0.988 (0.973, 0.997) | 0.916 | ||||||||
| NCH | 24 hours | 0.895 (0.833, 0.950) | 0.984 (0.957, 1.000) | N/A | N/A | |||||||
| 72 hours | 0.904 (0.850, 0.949) | 0.947 (0.890, 0.991) | 0.931 (0.897, 0.959) | 0.927 | ||||||||
a , b , Performance (ROC) (top) and confusion matrices (bottom) of the EXAM FL model on the CDH dataset for prediction of oxygen requirement at 24 h ( a ) and 72 h ( b ). ROCs for three different cutoff values ( t ) of the EXAM risk score are shown.
For MV at CDH at 72 h, EXAM had a low false-negative rate of 7.1%. Representative failure cases are presented in Extended Data Fig. 4 , showing two false-negative cases from CDH where one case had many missing EMR data features and the other had a CXR with a motion artifact and some missing EMR features.
Use of differential privacy
A primary motivation for healthcare institutes to use FL is to preserve the security and privacy of their data, as well as adherence to data compliance measures. For FL, there remains the potential risk of model ‘inversion’ 47 or even the reconstruction of training images from the model gradients themselves 48 . To counter these risks, security-enhancing measures were used to mitigate risk in the event of data ‘interception’ during site-server communication 49 . We experimented with techniques to avoid interception of FL data, and added a security feature that we believe could encourage more institutions to use FL. We thus validated previous findings showing that partial weight sharing, and other differential privacy techniques, can successfully be applied in FL 50 . Through investigation of a partial weight-sharing scheme 50 , 51 , 52 , we showed that models can reach a comparable performance even when only 25% of weight updates are shared (Extended Data Fig. 5 ).
Discussion
This study features a large, real-world healthcare FL study in terms of number of sites and number of data points used. We believe that it provides a powerful proof-of-concept of the feasibility of using FL for fast and collaborative development of needed AI models in healthcare. Our study involved multiple sites across four continents and under the oversight of different regulatory bodies, and thus holds the promise of being provided to different regulated markets in an expedited way. The global FL model, EXAM, proved to be more robust and achieved better results at individual sites than any model trained on only local data. We believe that consistent improvement was achieved owing to a larger, but also a more diverse, dataset, the use of data inputs that can be standardized and avoidance of clinical impressions/reported symptoms. These factors played an important part in increasing the benefits from this FL approach and its impact on performance, generalizability and, ultimately, the model’s usability.
For a client site with a relatively small dataset, two typical approaches could be used for fitting a useful model: one is to train locally with its own data, the other is to apply a model trained on a larger dataset. For sites with small datasets, it would have been virtually impossible to build a performant deep learning model using only their local data. The finding, that these two approaches were outperformed on all three prediction tasks by the global FL model, indicates that the benefit for client sites with small datasets arising from participation in FL collaborations is substantial. This is probaby a reflection of FL’s ability to capture more diversity than local training, and to mitigate the bias present in models trained on a homogenous population. An under-represented population or age group in one hospital/region might be highly represented in another region—such as children who might be differentially affected by COVID-19, including disease manifestations in lung imaging 46 .
The validation results confirmed that the global model is robust, supporting our hypothesis that FL-trained models are generalizable across healthcare systems. They provide a compelling case for the use of predictive algorithms in COVID-19 patient care, and the use of FL in model creation and testing. By participating in this study the client sites received access to EXAM, to be further validated ahead of pursuing any regulatory approval or future introduction into clinical care. Plans are under way to validate EXAM prospectively in ‘production’ settings at MGB leveraging COVID-19 targeted resources 53 , as well as at different sites that were not a part of the EXAM training.
Over 200 prediction models to support decision-making in patients with COVID-19 have been published 19 . Unlike the majority of publications focused on diagnosis of COVID-19 or prediction of mortality, we predicted oxygen requirements that have implications for patient management. We also used cases with unknown SARS-COV-2 status, and so the model could provide input to the physician ahead of receiving a result for PCR with reverse transcription (RT–PCR), making it useful for a real-life clinical setting. The model’s imaging input is used in common practice, in contrast with models that use chest computed tomography, a nonconsensual diagnostic modality. The model’s design was constrained to objective predictors, unlike many published studies that leveraged subjective clinical impressions. The data collected reflect varied incidence rates, and thus the ‘population momentum’ we encountered is more diverse. This implies that the algorithm can be useful in populations with different incidence rates.
Patient cohort identification and data harmonization are not novel issues in research and data science 54 , but are further complicated, when using FL, given the lack of visibility on other sites’ datasets. Improvements to clinical information systems are needed to streamline data preparation, leading to better leverage of a network of sites participating in FL. This, in conjunction with hyperparameter engineering, can allow algorithms to ‘learn’ more effectively from larger data batches and adapt model parameters to a particular site for further personalization—for example, through further fine-tuning on that site 39 . A system that would allow seamless, close-to real-time model inference and results processing would also be of benefit and would ‘close the loop’ from training to model deployment.
Because data were not centralized they are not readily accessible. Given that, any future analysis of the results, beyond what was derived and collected, is limited.
Similar to other machine learning models, EXAM is limited by the quality of the training data. Institutions interested in deploying this algorithm for clinical care need to understand potential biases in the training. For example, the labels used as ground truth in the training of the EXAM model were derived from 24- and 72-h oxygen consumption in the patient; it is assumed that oxygen delivered to the patient equates the oxygen need. However, in the early phase of the COVID-19 pandemic, many patients were provided high-flow oxygen prophylactically regardless of their oxygen need. Such clinical practice could skew the predictions made by this model.
Since our data access was limited, we did not have sufficient available information for the generation of detailed statistics regarding failure causes, post hoc, at most sites. However, we did study failure cases from the largest independent test site, CDH, and were able to generate hypotheses that we can test in the future. For high-performing sites, it seems that most failure cases fall into one of two categories: 1 low quality of input data—for example, missing data or motion artifact in CXR; or 2 out-of-distribution data—for example a very young patient.
In future, we also intend to investigate the potential for a ‘population drift’ due to different phases of disease progression. We believe that, owing to the diversity across the 20 sites, this risk may have been mitigated.
A feature that would enhance these kinds of large-scale collaboration is the ability to predict the contribution of each client site towards improving the global FL model. This will help in client site selection, and in prioritization of data acquisition and annotation efforts. The latter is especially important given the high costs and difficult logistics of these large-consortia endeavors, and it will enable these endeavors to capture diversity rather than the sheer quantity of data samples.
Future approaches may incorporate automated hyperparameter searching 55 , neural architecture search 56 and other automated machine learning 57 approaches to find the optimal training parameters for each client site more efficiently.
Known issues of batch normalization (BN) in FL 58 motivated us to fix our base model for image feature extraction 49 to reduce the divergence between unbalanced client sites. Future work might explore different types of normalization techniques to allow the training of AI models in FL more effectively when client data are nonindependent and identically distributed.
Recent works on privacy attacks within the FL setting have raised concerns on data leakage during model training 59 . Meanwhile, protection algorithms remain underexplored and constrained by multiple factors. While differential privacy algorithms 36 , 48 , 49 show good protection, they may weaken the model’s performance. Encryption algorithms, such as homomorphic encryption 60 , maintain performance but may substantially increase message size and training time. A quantifiable way to measure privacy would allow better choices for deciding the minimal privacy parameters necessary while maintaining clinically acceptable performance 36 , 48 , 49 .
Following further validation, we envision deployment of the EXAM model in the ED setting as a way to evaluate risk at both the per-patient and population level, and to provide clinicians with an additional reference point when making the frequently difficult task of triaging patients. We also envision using the model as a more sensitive population-level metric to help balance resources between regions, hospitals and departments. Our hope is that similar FL efforts can break the data silos and allow for faster development of much-needed AI models in the near future.
Methods
Ethics approval
All procedures were conducted in accordance with the principles for human experimentation as defined in the Declaration of Helsinki and International Conference on Harmonization Good Clinical Practice guidelines, and were approved by the relevant institutional review boards at the following validation sites: CDH, MVH, NCH and at the following training sites: MGB, Mass General Hospital (MGH), Brigham and Women’s Hospital, Newton-Wellesley Hospital, North Shore Medical Center and Faulkner Hospital (all eight of these hospitals were covered under MGB’s ethics board reference, no. 2020P002673, and informed consent was waived by the instititional review board (IRB). Similarly, participation of the remaining sites was approved by their respective relevant institutional review processes: Children’s National Hospital in Washington, DC (no. 00014310, IRB certified exempt); NIHR Cambridge Biomedical Research Centre (no. 20/SW/0140, informed consent waived); The Self-Defense Forces Central Hospital in Tokyo (no. 02-014, informed consent waived); National Taiwan University MeDA Lab and MAHC and Taiwan National Health Insurance Administration (no. 202108026 W, informed consent waived); Tri-Service General Hospital in Taiwan (no. B202105136, informed consent waived); Kyungpook National University Hospital in South Korea (no. KNUH 2020-05-022, informed consent waived); Faculty of Medicine, Chulalongkorn University in Thailand (nos. 490/63, 291/63, informed consent waived); Diagnosticos da America SA in Brazil (no. 26118819.3.0000.5505, informed consent waived); University of California, San Francisco (no. 20-30447, informed consent waived); VA San Diego (no. H200086, IRB certified exempt); University of Toronto (no. 20-0162-C, informed consent waived); National Institutes of Health in Bethesda, Maryland (no. 12-CC-0075, informed consent waived); University of Wisconsin-Madison School of Medicine and Public Health (no. 2016-0418, informed consent waived); Memorial Sloan Kettering Cancer Center in New York (no. 20-194, informed consent waived); and Mount Sinai Health System in New York (no. IRB-20-03271, informed consent waived).
MI-CLAIM guidelines for reporting of clinical AI models were followed (Supplementary Note 2 )
Study setting
The study included data from 20 institutions (Fig. 1a ): MGB, MGH, Brigham and Women’s Hospital, Newton-Wellesley Hospital, North Shore Medical Center and Faulkner Hospital; Children’s National Hospital in Washington, DC; NIHR Cambridge Biomedical Research Centre; The Self-Defense Forces Central Hospital in Tokyo; National Taiwan University MeDA Lab and MAHC and Taiwan National Health Insurance Administration; Tri-Service General Hospital in Taiwan; Kyungpook National University Hospital in South Korea; Faculty of Medicine, Chulalongkorn University in Thailand; Diagnosticos da America SA in Brazil; University of California, San Francisco; VA San Diego; University of Toronto; National Institutes of Health in Bethesda, Maryland; University of Wisconsin-Madison School of Medicine and Public Health; Memorial Sloan Kettering Cancer Center in New York; and Mount Sinai Health System in New York. Institutions were recruited between March and May 2020. Dataset curation started in June 2020 and the final data cohort was added in September 2020. Between August and October 2020, 140 independent FL runs were conducted to develop the EXAM model and, by the end of October 2020, EXAM was made public on NVIDIA NGC 61 , 62 , 63 . Data from three independent sites were used for independent validation: CDH, MVH and NCH, all in Massachusetts, USA. These three hospitals had patient population characteristics different from the training sites. The data used for the algorithm validation consisted of patients admitted to the ED at these sites between March 2020 and February 2021, and that satisfied the same inclusion criteria of the data used to train the FL model.
Data collection
The 20 client sites prepared a total of 16,148 cases (both positive and negative) for the purposes of training, validation and testing of the model (Fig. 1b ). Medical data were accessed in relation to patients who satisfied the study inclusion criteria. Client sites strived to include all COVID-positive cases from the beginning of the pandemic in December 2019 and up to the time they started local training for the EXAM study. All local training had started by 30 September 2020. The sites also included other patients in the same period with negative RT–PCR test results. Since most of the sites had more SARS-COV-2-negative than -positive patients, we limited the number of negative patients included to, at most, 95% of the total cases at each client site.
A ‘case’ included a CXR and the requisite data inputs taken from the patient’s medical record. A breakdown of the cohort size of the dataset for each client site is shown in Fig. 1b . The distribution and patterns of CXR image intensity (pixel values) varied greatly among sites owing to a multitude of patient- and site-specific factors, such as different device manufacturers and imaging protocols, as shown in Fig. 1c,d . Patient age and EMR feature distribution varied greatly among sites, as expected owing to the differing demographics between globally distributed hospitals (Extended Data Fig. 6 ).
Patient inclusion criteria
Patient inclusion criteria were: 1 patient presented to the hospital’s ED or equivalent; 2 patient had a RT–PCR test performed at any time between presentation to the ED and discharge from the hospital; 3 patient had a CXR in the ED; and 4 patient’s record had at least five of the EMR values detailed in Table 1 , all obtained in the ED, and the relevant outcomes captured during hospitalization. Of note, The CXR, laboratory results and vitals used were the first available for capture during the visit to the ED. The model did not incorporate any CXR, laboratory results or vitals acquired after leaving the ED.
Model input
In total, 21 EMR features were used as input to the model. The outcome (that is, ground truth) labels were assigned based on patient requirements after 24- and 72-h periods from initial admission to the ED. A detailed list of the requested EMR features and outcomes can be seen in Table 1 .
The distribution of oxygen treatment using different devices at different client sites is shown in Extended Data Fig. 7 , which details the device usage at admission to the ED and after 24- and 72-h periods. The difference in dataset distribution between the largest and smallest client sites can be seen in Extended Data Fig. 8 .
The number of positive COVID-19 cases, as confirmed by a single RT–PCR test obtained at any time between presentation to the ED and discharge from the hospital, is listed in Supplementary Table 1 . Each client site was asked to randomly split its dataset into three parts: 70% for training, 10% for validation and 20% for testing. For both 24- and 72-h outcome prediction models, random splits for each of the three repeated local and FL training and evaluation experiments were independently generated.
EXAM model development
There is wide variation in the clinical course of patients who present to hospital with symptoms of COVID-19, with some experiencing rapid deterioration in respiratory function requiring different interventions to prevent or mitigate hypoxemia 62 , 63 . A critical decision made during the evaluation of a patient at the initial point of care, or in the ED, is whether the patient is likely to require more invasive or resource-limited countermeasures or interventions (such as MV or monoclonal antibodies), and should therefore receive a scarce but effective therapy, a therapy with a narrow risk–benefit ratio due to side effects or a higher level of care, such as admittance to the intensive care unit 64 . In contrast, a patient who is at lower risk of requiring invasive oxygen therapy may be placed in a less intensive care setting such as a regular ward, or even released from the ED for continuing self-monitoring at home 65 . EXAM was developed to help triage such patients.
Of note, the model is not approved by any regulatory agency at this time and it should be used only for research purposes.
EXAM score
EXAM was trained using FL; it outputs a risk score (termed EXAM score) similar to CORISK 27 (Extended Data Fig. 9a ) and can be used in the same way to triage patients. It corresponds to a patient’s oxygen support requirements within two windows—24 and 72 h—after initial presentation to the ED. Extended Data Fig. 9b illustrates how CORISK and the EXAM score can be used for patient triage.
Chest X-ray images were preprocessed to select the anterior position image and exclude lateral view images, and then scaled to a resolution of 224 × 224. As shown in Extended Data Fig. 9a , the model fuses information from both EMR and CXR features (based on a modified ResNet34 with spatial attention 66 pretrained on the CheXpert dataset) 67 and the Deep & Cross network 68 . To converge these different data types, a 512-dimensional feature vector was extracted from each CXR image using a pretrained ResNet34, with spatial attention, then concatenated with the EMR features as the input for the Deep & Cross network. The final output was a continuous value in the range 0–1 for both 24- and 72-h predictions, corresponding to the labels described above, as shown in Extended Data Fig. 9b . We used cross-entropy as the loss function and ‘Adam’ as the optimizer. The model was implemented in Tensorflow 69 using the NVIDIA Clara Train SDK 70 . The average AUC for the classification tasks (≥LFO, ≥HFO/NIV or ≥MV) was calculated and used as the final evaluation metric, with normalization to zero-mean and unit variance. CXR images were preprocessed to select the correct series and exclude lateral view images, then scaled to a resolution of 224 × 224 (ref. 27 ).
Feature imputation and normalization
A MissForest algorithm 71 was used to impute EMR features, based on the local training dataset. If an EMR feature was completely missing from a client site dataset, the mean value of that feature, calculated exclusively on data from MGB client sites, was used. Then, EMR features were rescaled to zero-mean and unit variance based on statistics calculated on data from the MGB client sites.
Details of EMR–CXR data fusion using the Deep & Cross network
To model the interactions of features from EMR and CXR data at the case level, a deep-feature scheme was used based on a Deep & Cross network architecture 68 . Binary and categorical features for the EMR inputs, as well as 512-dimensional image features in the CXR, were transformed into fused dense vectors of real values by embedding and stacking layers. The transformed dense vectors served as input to the fusion framework, which specifically employed a crossing network to enforce fusion among input from different sources. The crossing network performed explicit feature crossing within its layers, by conducting inner products between the original input feature and output from the previous layer, thus increasing the degree of interaction across features. At the same time, two individual classic deep neural networks with several stacked, fully connected feed-forward layers were trained. The final output of our framework was then derived from the concatenation of both classic and crossing networks.
FL details
Arguably the most established form of FL is implemention of the federated averaging algorithm as proposed by McMahan et al. 72 , or variations thereof. This algorithm can be realized using a client-server setup where each participating site acts as a client. One can think of FL as a method aiming to minimize a global loss function by reducing a set of local loss functions, which are estimated at each site. By minimizing each client site’s local loss while also synchronizing the learned client site weights on a centralized aggregation server, one can minimize global loss without needing to access the entire dataset in a centralized location. Each client site learns locally, and shares model weight updates with a central server that aggregates contributions using secure sockets layer encryption and communication protocols. The server then sends an updated set of weights to each client site after aggregation, and sites resume training locally. The server and client site iterate back and forth until the model converges (Extended Data Fig. 9c ).
A pseudoalgorithm of FL is shown in Supplementary Note 1 . In our experiments, we set the number of federated rounds at T = 200, with one local training epoch per round t at each client. The number of clients, K , was up to 20 depending on the network connectivity of clients or available data for a specific targeted outcome period (24 or 72 h). The number of local training iterations, n k , depends on the dataset size at each client k and is used to weigh each client’s contributions when aggregating the model weights in federated averaging. During the FL training task, each client site selects its best local model by tracking the model’s performance on its local validation set. At the same time, the server determines the best global model based on the average validation scores sent from each client site to the server after each FL round. After FL training finishes, the best local models and the best global model are automatically shared with all client sites and evaluated on their local test data.
When training on local data only (the baseline), we set the epoch number to 200. The Adam optimizer was used for both local training and FL with an initial learning rate of 5 × 10 –5 and a stepwise learning rate decay with a factor 0.5 after every 40 epochs, which is important for the convergence of federated averaging 73 . Random affine transformations, including rotation, translations, shear, scaling and random intensity noise and shifts, were applied to the images for data augmentation during training.
Owing to the sensitivity of BN layers 58 when dealing with different clients in a nonindependent and identically distributed setting, we found the best model performance occurred when keeping the pretrained ResNet34 with spatial attention 47 parameters fixed during FL training (that is, using a learning rate of zero for those layers). The Deep & Cross network that combines image features with EMR features does not contain BN layers and hence was not affected by BN instability issues.
In this study we investigated a privacy-preserving scheme that shares only partial model updates between server and client sites. The weight updates were ranked during each iteration by magnitude of contribution, and only a certain percentage of the largest weight updates was shared with the server. To be exact, weight updates (also known as gradients) were shared only if their absolute value was above a certain percentile threshold, k (t) (Extended Data Fig. 5 ), which was computed from all non-zero gradients, Δ W k (t) , and could be different for each client k in each FL round t . Variations of this scheme could include additional clipping of large gradients or differential privacy schemes 49 that add random noise to the gradients, or even to the raw data, before feeding into the network 51 .
Statistical analysis
We conducted a Wilcoxon signed-rank test to confirm the significance of the observed improvement in performance between the locally trained model and the FL model for the 24- and 72-h time points (Fig. 2 and Extended Data Fig. 1 ). The null hypothesis was rejected with one-sided P « 1 × 10 –3 in both cases.
Pearson’s correlation was used to assess the generalizability (robustness of the average AUC value to other client sites’ test data) of locally trained models in relation to respective local dataset size. Only a moderate correlation was observed ( r = 0.43, P = 0.035, degrees of freedom (df) = 17 for the 24-h model and r = 0.62, P = 0.003, df = 16 for the 72-h model). This indicates that dataset size alone is not the only factor determining a model’s robustness to unseen data.
To compare ROC curves from the global FL model and local models trained at different sites (Extended Data Fig. 3 ), we bootstrapped 1,000 samples from the data and computed the resulting AUCs. We then calculated the difference between the two series and standardized using the formula D = (AUC1 – AUC2)/ s , where D is the standardized difference, s is the standard deviation of the bootstrap differences and AUC1 and AUC2 are the corresponding bootstrapped AUC series. By comparing D with normal distribution, we obtained the P values illustrated in Supplementary Table 2 . The results show that the null hypothesis was rejected with very low P values, indicating the statistical significance of the superiority of FL outcomes. The computation of P values was conducted in R with the pROC library 74 .
Since the model predicts a discrete outcome, a continuous score from 0 to 1, a straightforward calibration evaluation such as a qqplot is not possible. Hence, for a quantified estimate of calibration we quantified discrimination (Extended Data Fig. 10 ). We conducted one-way analysis of variation (ANOVA) tests to compare local and FL model scores among four ground truth categories (RA, LFO, HFO, MV). The F -statistic, calculated as the variation between the sample means divided by variation within the samples and representing the degree of dispersion among different groups, was used to quantify the models. Our results show that the F -values of five different local sites are 245.7, 253.4, 342.3, 389.8 and 634.8, while that of the FL model is 843.5. Given that larger F -values mean that groups are more separable, the scores from our FL model clearly show a greater dispersion among the four ground truth categories. Furthermore, the P value of the ANOVA test on the FL model is <2 × 10 –16 , indicating that the FL prediction scores are statistically significantly different among the different prediction classes.
Reporting Summary
Further information on research design is available in the Nature Research Reporting Summary linked to this article.
Code availability
All code and software used in this study are publicly available at NGC. To access, log in as a guest or create a profile then enter one of the URLs below. The trained models, data preparation guidelines, code for training, validating testing of the model, readme file, installation guideline and license files are publicly available at NVIDIA NGC 61 : https://ngc.nvidia.com/catalog/models/nvidia:med:clara_train_covid19_exam_ehr_xray The federated learning software is available as part of the Clara Train SDK: https://ngc.nvidia.com/catalog/containers/nvidia:clara-train-sdk . Alternatively, use this command to download the model “wget --content-disposition https://api.ngc.nvidia.com/v2/models/nvidia/med/clara_train_covid19_exam_ehr_xray/versions/1/zip -O clara_train_covid19_exam_ehr_xray_1.zip”.
Extended data
Extended Data Fig. 1 Test performance of models predicting 72 h oxygen treatment trained on local data only versus the performance of the best global model available on the server.
Test performance of models predicting 72 h oxygen treatment trained on local data only (Local) versus the performance of the best global model available on the server (FL (gl. best)). b, Generalizability (average performance on other sites’ test data) as a function of a site’s dataset size (# cases). The average performance improved by 18% (from 0.760 to 0.899 or 13.9 percentage points) compared to locally trained models alone, while average generalizability of the global model improved by 34% (from 0.669 to 0.899 or 23.0 percentage points).
Extended Data Fig. 2 Confusion Matrices at a site with unbalanced data and mostly mild cases.
Confusion Matrices at a site with unbalanced data and mostly mild cases. a , Confusion matrices on the test data at site 16 predicting oxygen treatment at 72 h using the locally trained model. b , Confusion matrices on the test data at site 16 predicting oxygen treatment at 72 h using the best Federated Learning global model. We show the ROCs for two different cut-off values t of the EXAM risk score.
Extended Data Fig. 3 Model performance on COVID-positive and COVID-negative patients.
ROCs of the best global model in comparison to the mean ROCs of models trained on local datasets to predict 24/72-h oxygen treatment devices for COVID positive/negative patients respectively, using the test data of 5 large datasets from sites in the Boston area. The Mean ROC is calculated based on 5 locally trained models, with the gray-area showing the standard deviation of the ROCs. We show the ROCs for three different cut-off values t of the EXAM risk score.
Extended Data Fig. 4 Failures cases at an independent test site.
Failures cases at an independent test site. CXRs from two failure cases at CDH. The above is noisy data where each available value has been anonymized by adding a zero-mean Gaussian noise with the standard deviation of 1/5 of the standard deviation of the cohort distribution.
Extended Data Fig. 5 Safety enhancing features used in EXAM.
Safety enhancing features used in EXAM. Additional data-safety-enhancing features were assessed by only sharing a certain percentage of weight updates with the largest magnitudes before sending them to the server after each round of learning52. We show that by using partial weight updates during FL, models can be trained that reach a performance comparable to training while sharing the full information. This differential privacy technique decreases the risk for model inversion or reconstruction of the training image data through gradient interception.
Extended Data Fig. 6 Characteristics of EMR data used in EXAM.
Characteristics of EMR data used in EXAM. Min. and max. values (asterisks) and mean and standard deviation (length of bars) for each EMR feature used as an input to the model. n specifies the number of sites that had this particular feature available. Missing values were imputed using a MissedForest algorithm.
Extended Data Fig. 7 Distribution of oxygen treatments between EXAM sites.
Distribution of oxygen treatments between EXAM sites. The boxplots show the quartiles of the minimum, the maximum, the sample median, and the first and third quartiles (excluding outliers) of the oxygen treatments applied at different sites at time of Emergency Department admission and after 24 and 72- hour periods. The types of oxygen treatments administered are ‘room air’, ‘low-flow oxygen’, ‘high-flow oxygen (non-invasive)’, and ‘ventilator’.
Extended Data Fig. 8 Site variations in oxygen usage.
Site variations in oxygen usage. Normalized distributions of oxygen devices at different time points, comparing the site with largest dataset size (site 1) and a site with unbalanced data, including mostly mild cases (site #16).
Extended Data Fig. 9 Description of the EXAM Federated Learning study.
Description of the EXAM Federated Learning study. a , Previously developed model, CDS, to predict a risk score that corresponds to respiratory outcomes in patients with SARS-COV-2. b , Histogram of CORISK results at MGB, with an illustration of how the score can be used for patient triage, in which ‘A’ is an example threshold for safe discharge that has 99.5% negative predictive value, and ‘B’ is an example threshold for Intensive Care Unit (ICU) admission that has 50.3% positive predictive value. For the purpose of the NPV calculation (threshold A), we defined the Model Inference to be Positive if it predicted oxygen need as LFO or above (COVID risk score ³0.25) and Negative if it predicted oxygen need as RA ( <0.25). We defined the Disease to be Negative if the patient was discharged and not readmitted, and Positive if the patient was readmitted for treatment. For the purpose of PPV calculation (threshold B), we defined the Model Inference to be Positive if it predicted oxygen need as MV or above (³0.75) and Negative if it predicted oxygen need as HFO or less (<0.75). We defined the disease to be Positive if the patient required MV or if they died, and we defined the disease as Negative if the patient survived and did not require MV. The EXAM score can be used in the same way. c , Federated Learning using a client-server setup.
Extended Data Fig. 10 Calibration Plots for the MGB data and the new independent dataset, CDH, used for model validation.
Calibration Plots for the MGB data and the new independent dataset, CDH, used for model validation.
Notas
Competing interests Financial competing interests This study was organized and coordinated by NVIDIA. Y.W., M.A., I.Y., A.Q., C.C., D.B., A.F., H.R., J.G., D.X., N.R., A.H., K.K., C.R., A.A., C.K.L, E.H., A.L., G.L., P.M.C.S, J.T., and M.G.F. are employees of NVIDIA and own stock as part of the standard compensation package. J.G. declared ownership of NVIDIA Stock. I.D. is presently an officer and shareholder of a company, Rhino HealthTech Inc., that provides systems for distributed computation, that can among other things, be used to complete federated learning tasks. He was not employed by this company during the execution of the EXAM study. The remaining authors declare no competing interests. Non-financial competing interests C.H. declared Research travel, Siemens Healthineers AG; Conference Travel, EUROKONGRESS; GmBH; and Personal fees (Consultant, GE Healthcare LLC; DSMB Member, Focused Ultrasound Foundation). F.J.G declared research collaborations with Merantix, Screen-Point, Lunit and Volpara, GE Healthcare and undertakes paid consultancy for Kheiron and Alphabet. M.L. declared that he is the co-founder of PediaMetrix Inc. and is on the Board of the SIPAIM Foundation S.E.H declared research collaborations with Merantix, Screen-Point, Lunit and Volpara. B.J.W and S.X. declared that NIH and NVIDIA have a Cooperative Research and Development Agreement. This work was supported (+/− in part) by the NIH Center for Interventional Oncology and the Intramural Research Program of the National Institutes of Health, via intramural NIH Grants Z1A CL040015, 1ZIDBC011242. Work supported by the NIH Intramural Targeted Anti-COVID-19 (ITAC) Program, funded by the National Institute of Allergy and Infectious Diseases. NIH may have intellectual property in the field. The remaining authors declare no competing interests. Editor summary: Federated learning, a method for training artificial intelligence algorithms that protects data privacy, was used to predict future oxygen requirements of symptomatic COVID-19 patients using data from 20 different institutes across the globe. Editor recognition statement: Michael Basson was the primary editor on this article and managed its editorial process and peer review in collaboration with the rest of the editorial team. Reviewer recognition statement: Nature Medicine thanks Fei Wang, Nikos Paragios and the other, anonymous, reviewer(s) for their contribution to the peer review of this work.